survey conducted by
Ministry of Agriculture, Fisheries and Food;
Department of Analysis and Agricultural StatisticsEarth Observation Data
Spain cycle 1 demonstration
This page highlights our comprehensive study, focusing on the following key use cases:
- Cost Efficiency: Understand how EO data optimizes resource allocation and reduces expenses.
- Statistical Granularity: Dive into the depths of data precision and detail provided by EO.
- Sampling Design: Explore innovative approaches in data sampling that enhance accuracy.
- Sustainable Development Goals (SDG) Reporting: Learn how EO data contributes to monitoring and achieving global SDGs.
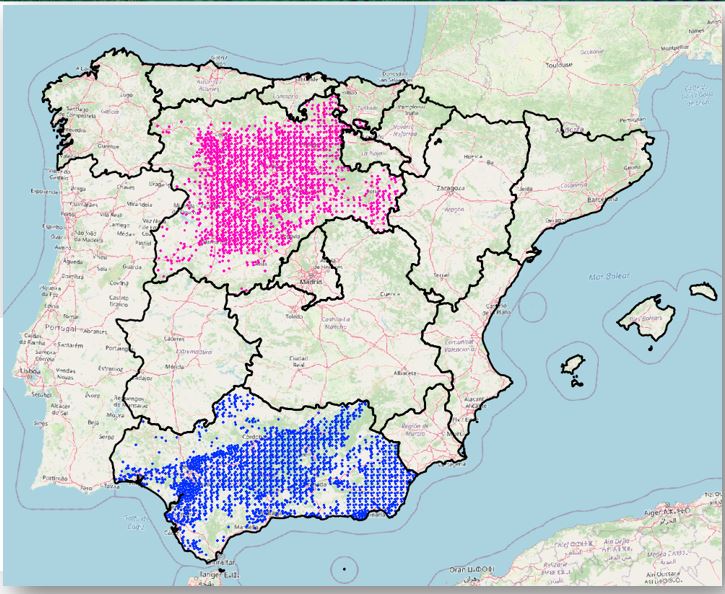
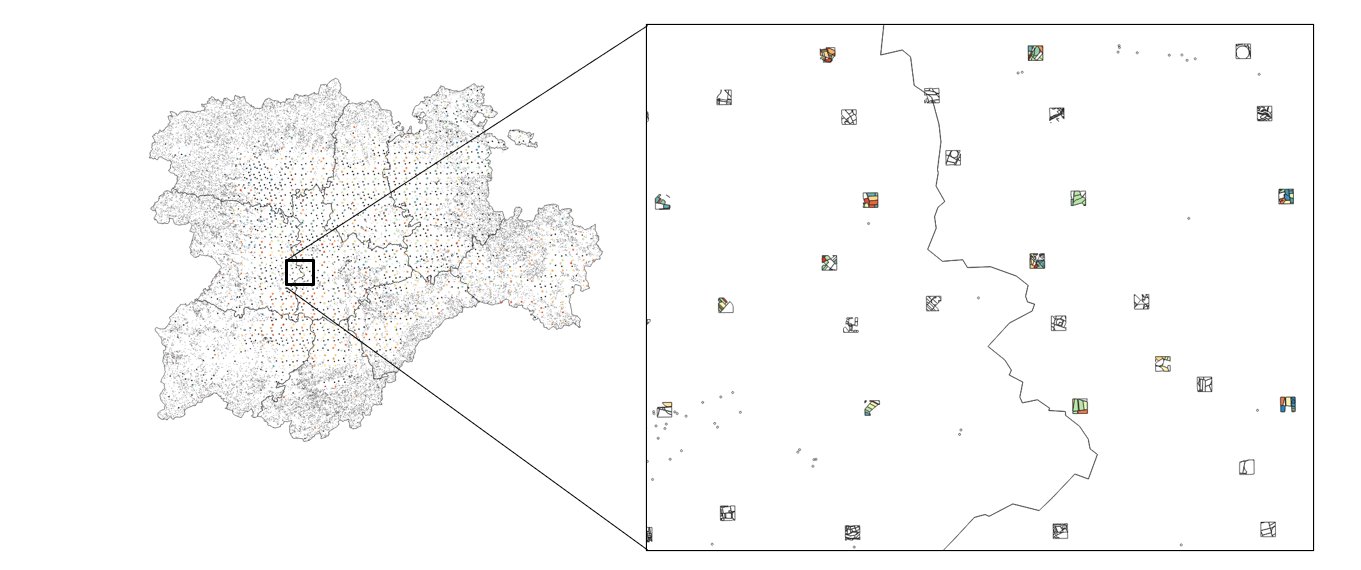
Our study predominantly centers on two expansive regions: Castilla y León and Andalusia. These areas serve as prime examples to demonstrate the practical applications and benefits of EO data. To enhance the reliability of our findings, we have incorporated "in situ" data from the ESYRCE 2020 survey, which covers approximately 500,000 polygons at a national level. This comprehensive data set enriches our analysis and provides a robust foundation for our conclusions. In this study, we pay special attention to:
To enhance the reliability of our findings, we have incorporated "in situ" data from the ESYRCE 2020 survey, which covers approximately 500,000 polygons at a national level. This comprehensive data set enriches our analysis and provides a robust foundation for our conclusions. This comprehensive data set enriches our analysis and provides a robust foundation for our conclusions.
In this study, we pay special attention to:
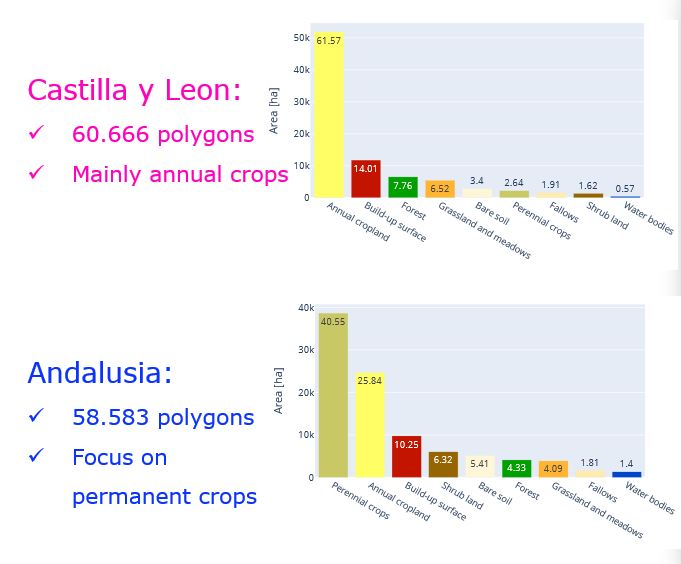
- Castilla y León (Approx. 60,000 polygons): Here, our focus is on the annual crops, providing insights into their patterns, health, and productivity.
- Andalusia (Approx. 60,000 polygons): This region is analyzed with a focus on permanent crops, offering a detailed look at long-term agricultural practices and outcomes.
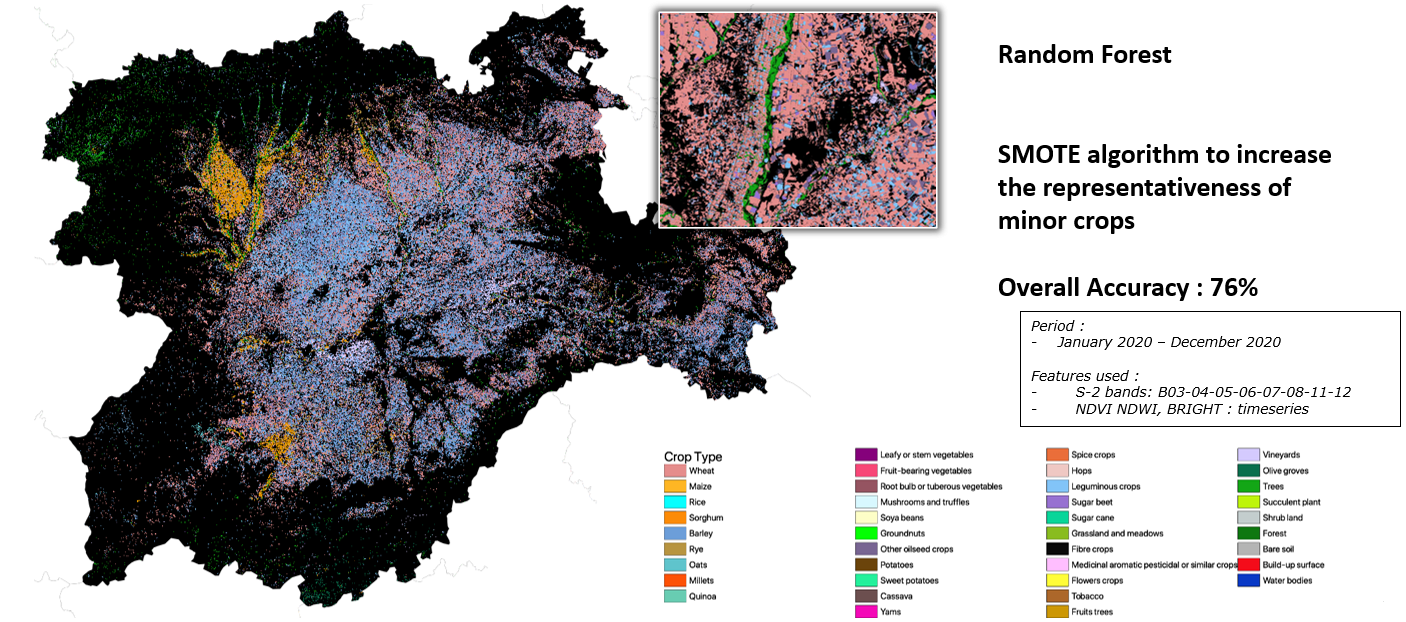
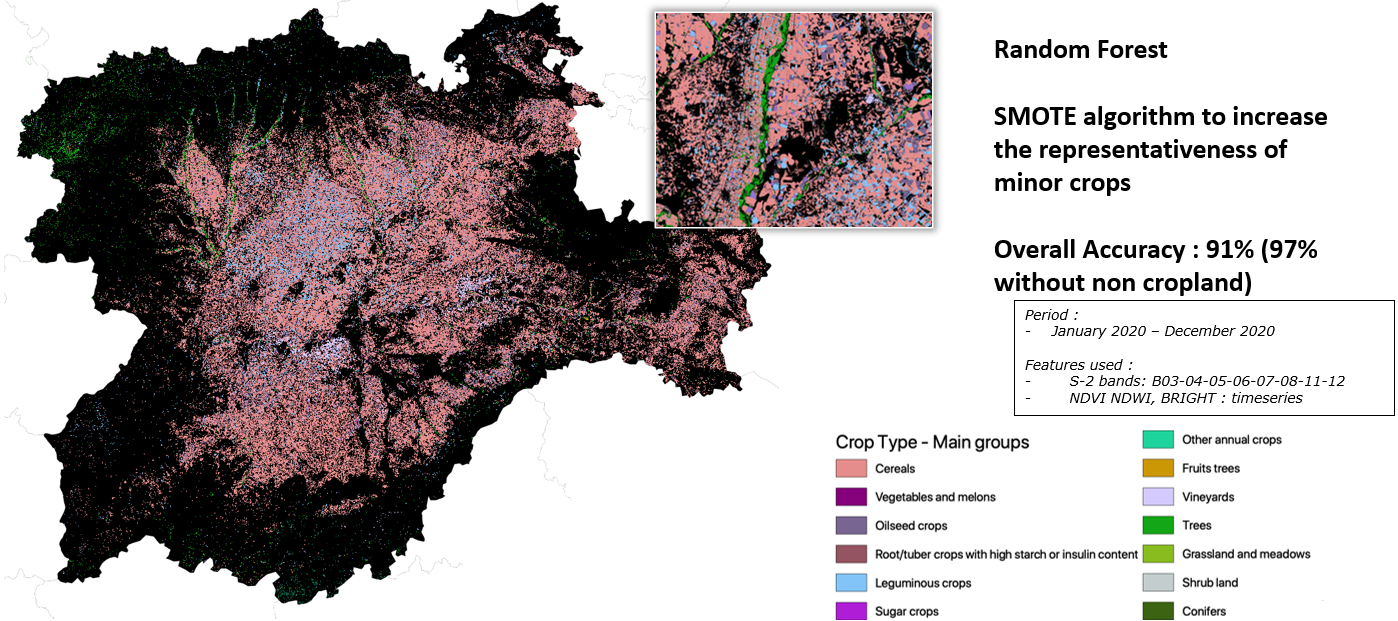
Crop type map in Castilla y Leon (28 crop classes)
A highly accurate crop type map have been produced on Castilla y Leon region based on the training data presented above. The SMOTE algorithm was also applied to ensure that minor crops were accurately represented in the map. The resulting crop type map has an overall accuracy of 76% and covers the period of January 2020 to December 2020. With 28 crop classes represented in the map, this highly accurate and detailed tool provides valuable insights into Spain's agricultural sector and can inform a range of decisions in the field.
Moving to main crop groups
Grouping individual crop types into main crop groups is a crucial step in simplifying agricultural data, making it more accessible, and facilitating decision-making. The accuracy of this process is paramount, and the resulting data should be reliable and informative. The grouping of crop types in main crop groups has resulted in a highly accurate dataset, with an overall accuracy of 84% (93% without non cropland). By simplifying the data in this way, it becomes easier to identify trends and patterns that might be difficult to discern otherwise, providing valuable insights into the agricultural sector. The resulting data can also be compared across different regions or countries, making it a useful tool for policymakers seeking to make informed decisions. Overall, moving to main crop groups is an effective way to analyze agricultural data and can support evidence-based policymaking.
The same work is done on Andalusia region:
Crop map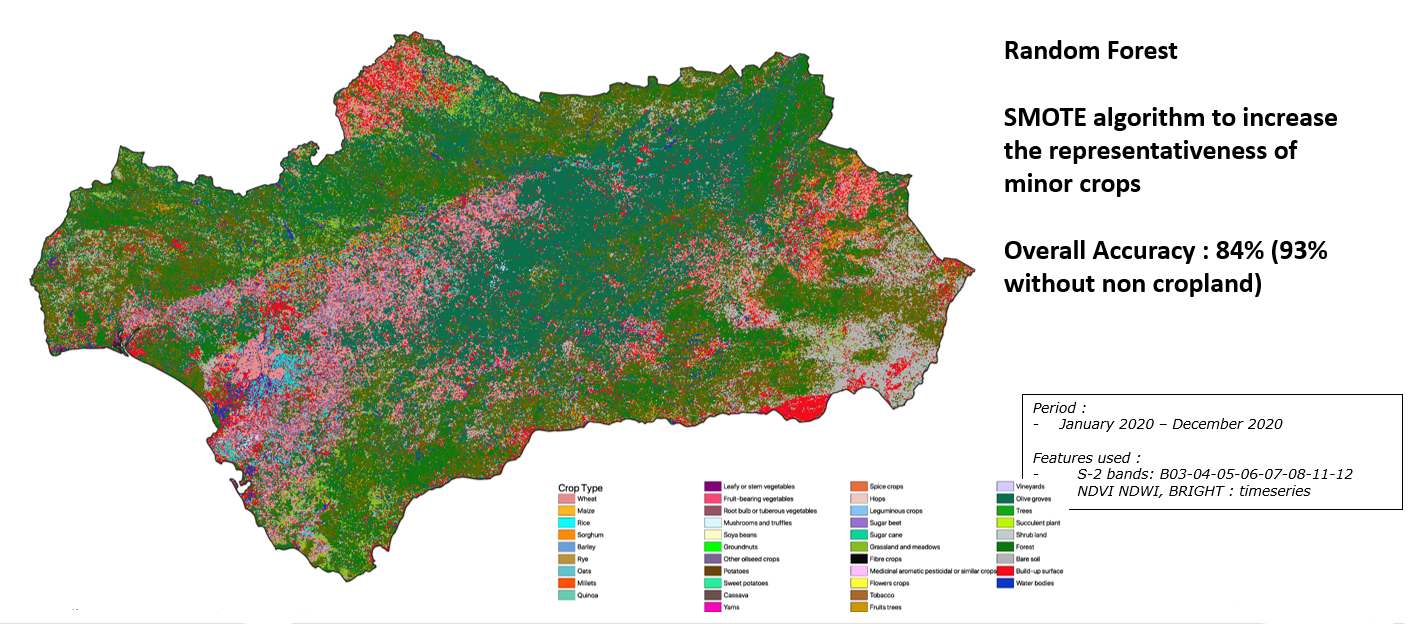
Main group map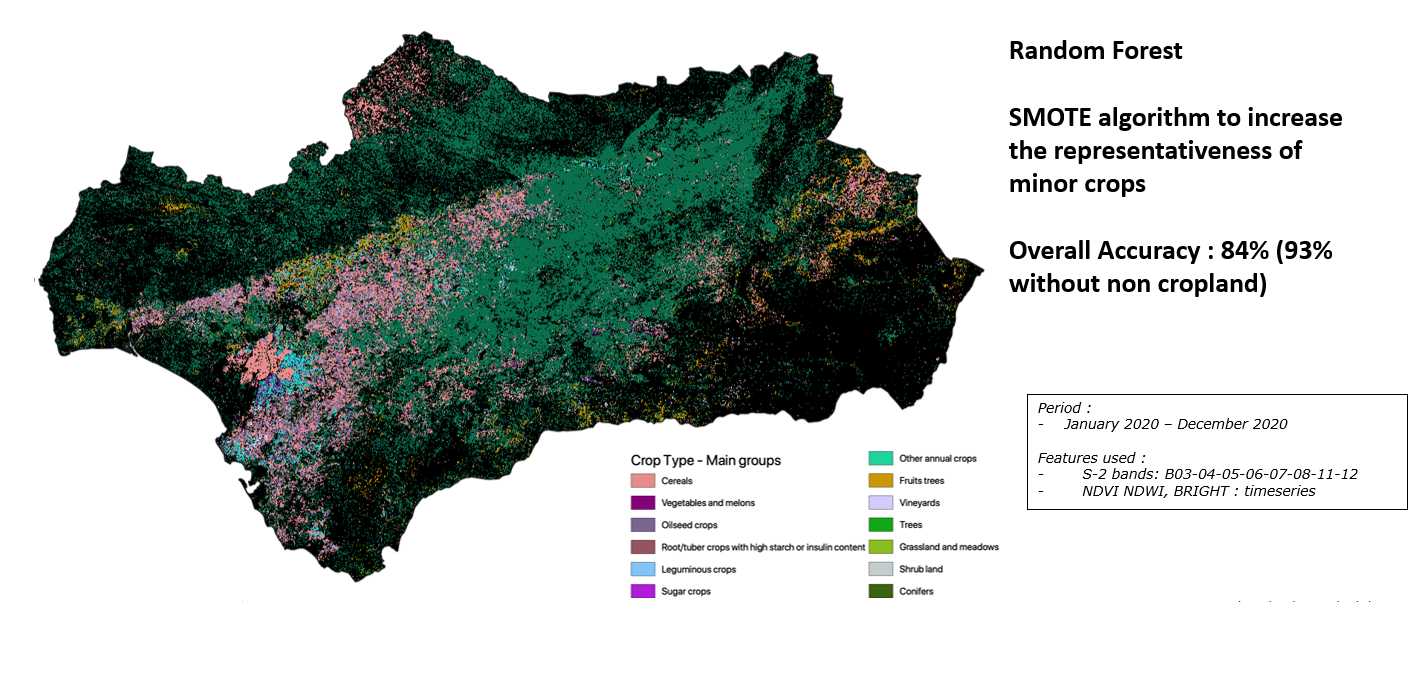
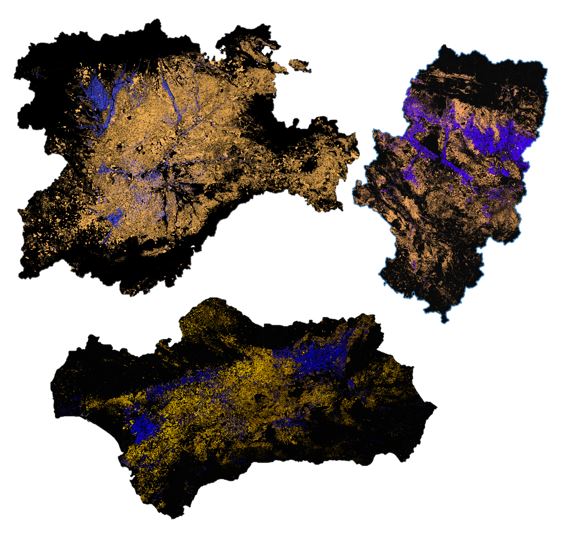
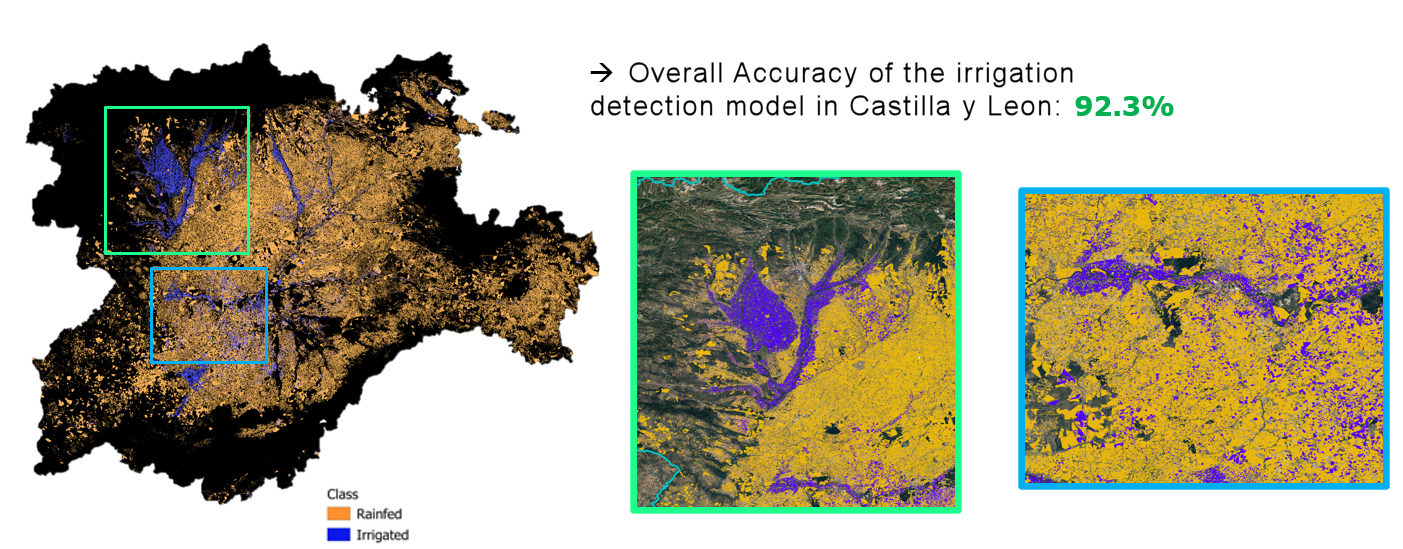
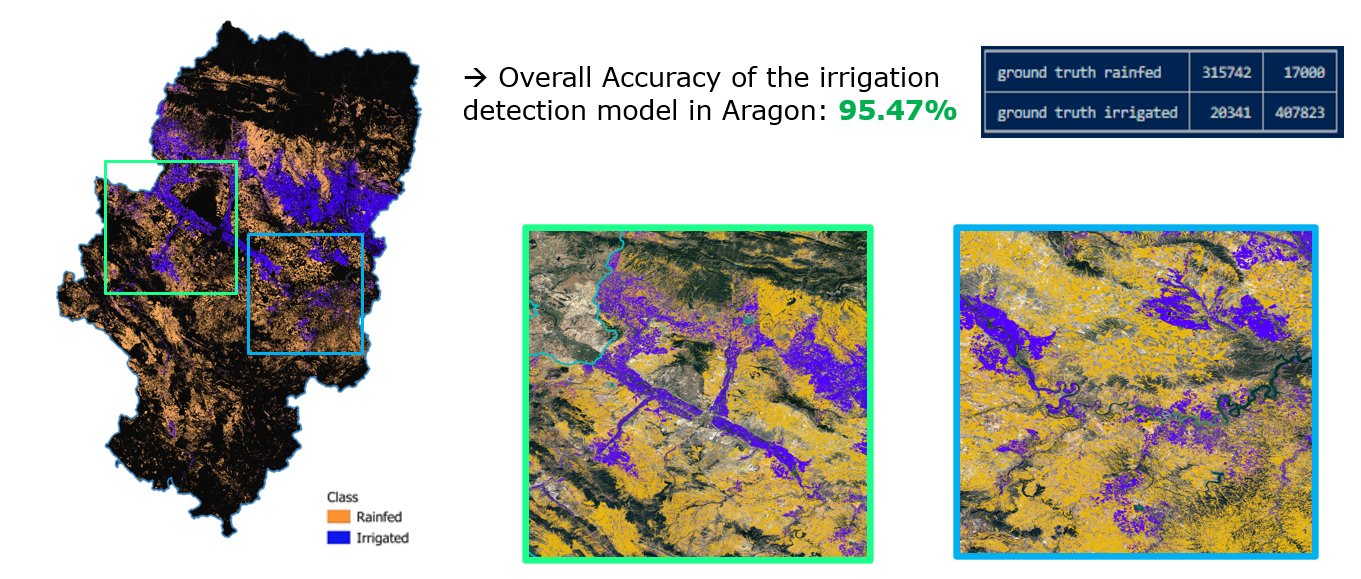
Map of irrigation
The National Statistics Office (NSO) has articulated a need for a comprehensive national map that identifies and distinguishes irrigated from non-irrigated regions. This detailed mapping is essential for pinpointing large potential areas for irrigation, which will significantly contribute to updating and refining the future sampling frame. In response to this need, we plan to effectively leverage and synthesize existing data sources. By utilizing the Land Parcel Identification System from 2020 along with the corresponding year’s ESYRCE data, our objective is to craft an irrigation map that meets the NSO's specifications.
Currently three autonomous communities classified with high accuracy:
- Andalucia
- Aragon
- Castilla y Leon
Use cases
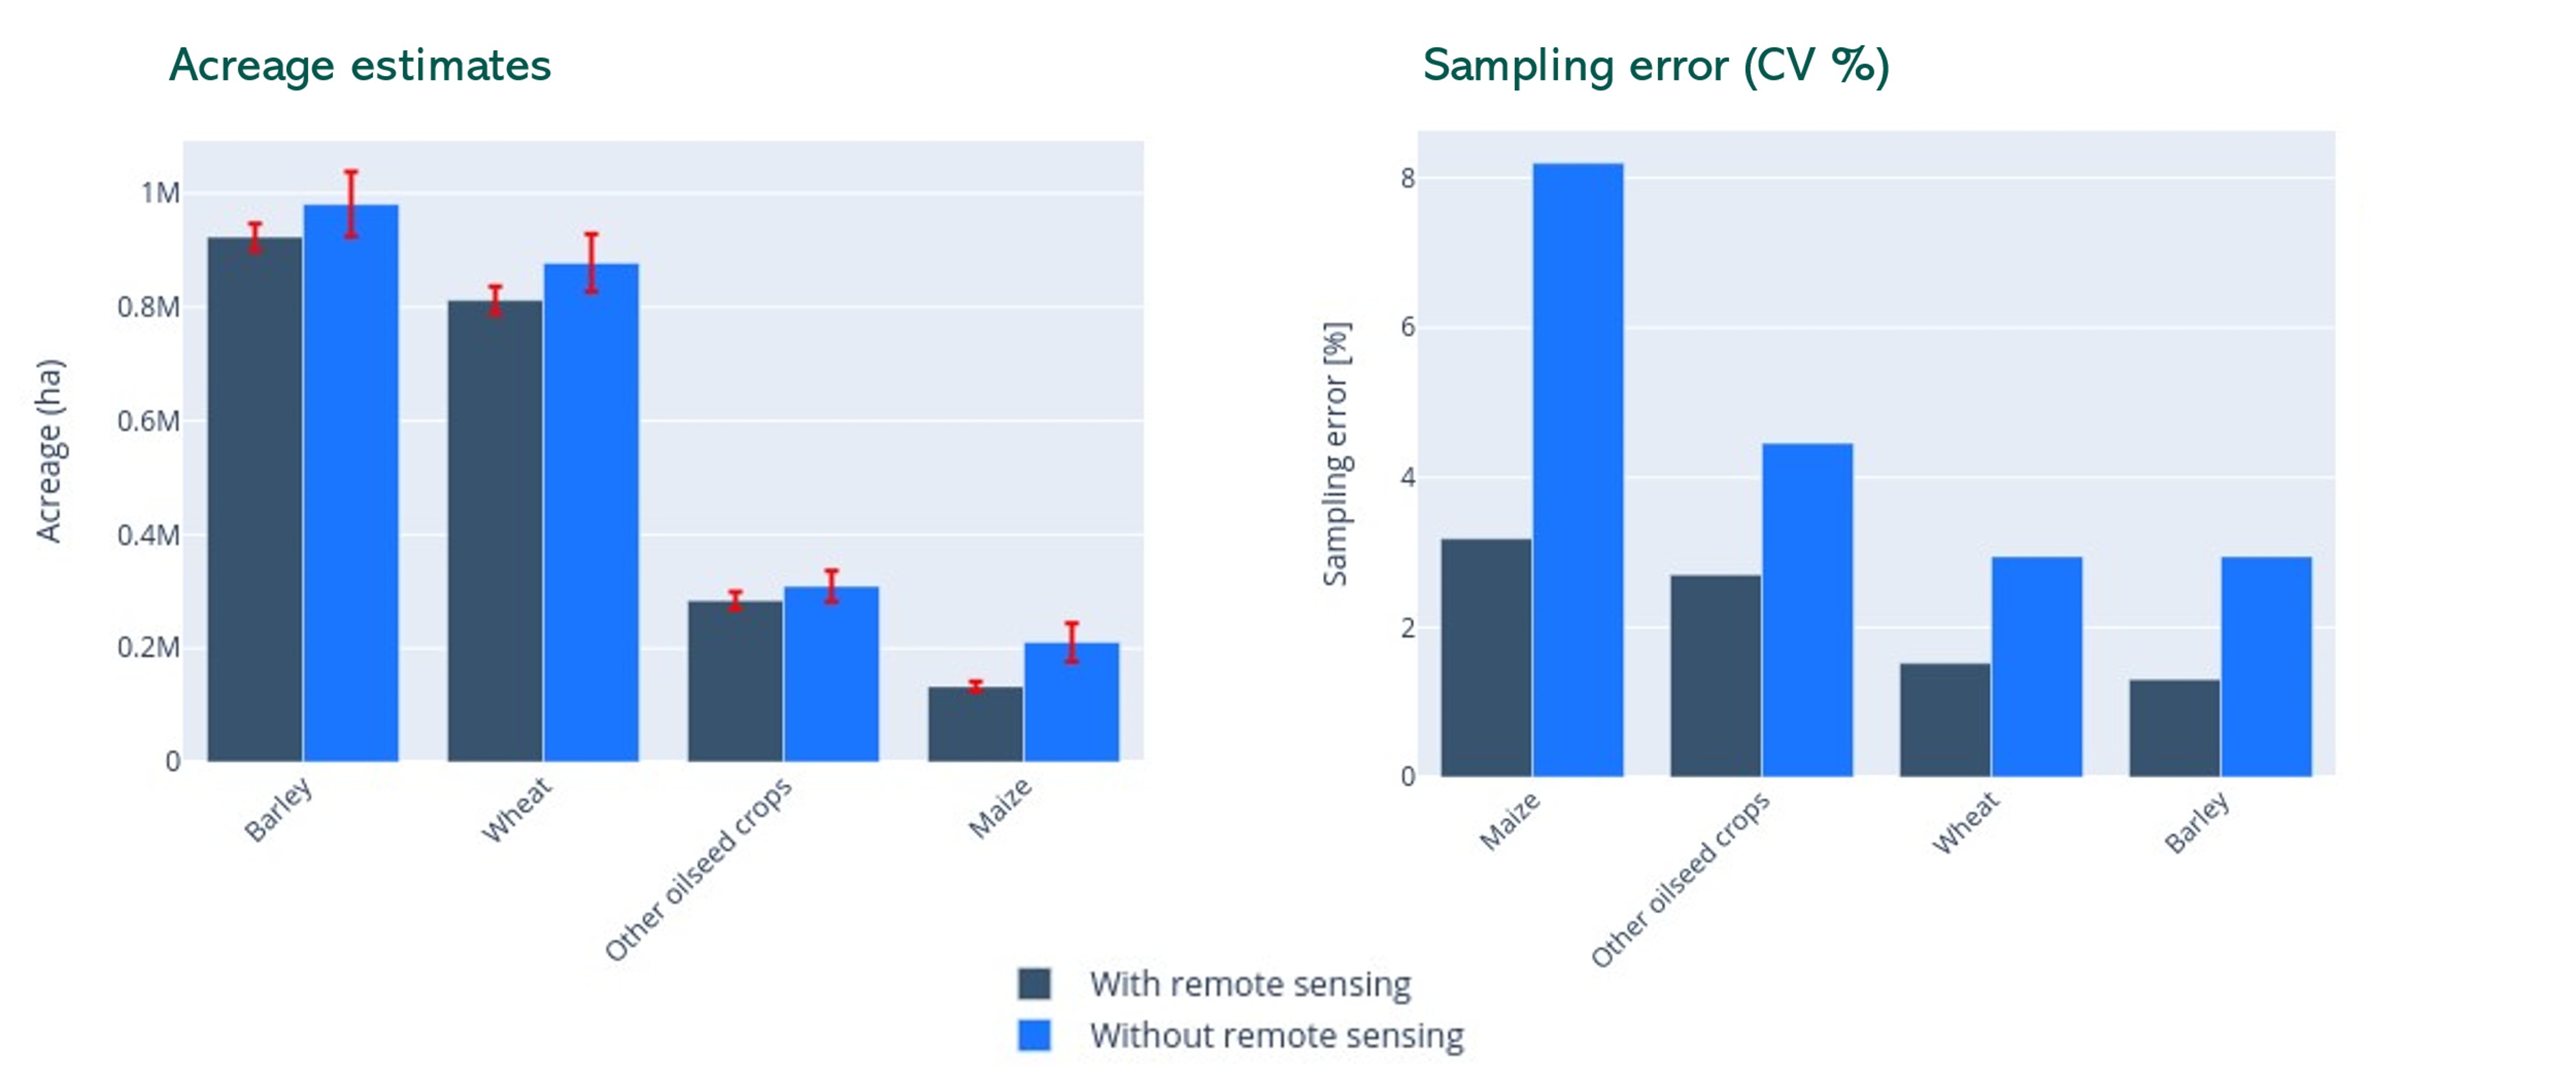
Use case 1: Cost-efficiency
Looking at 2 key criteria: survey cost and accuracy. Cost-efficiency = survey cost multiplied by sampling variance
Option 1: reducing the estimation error without increasing the survey cost
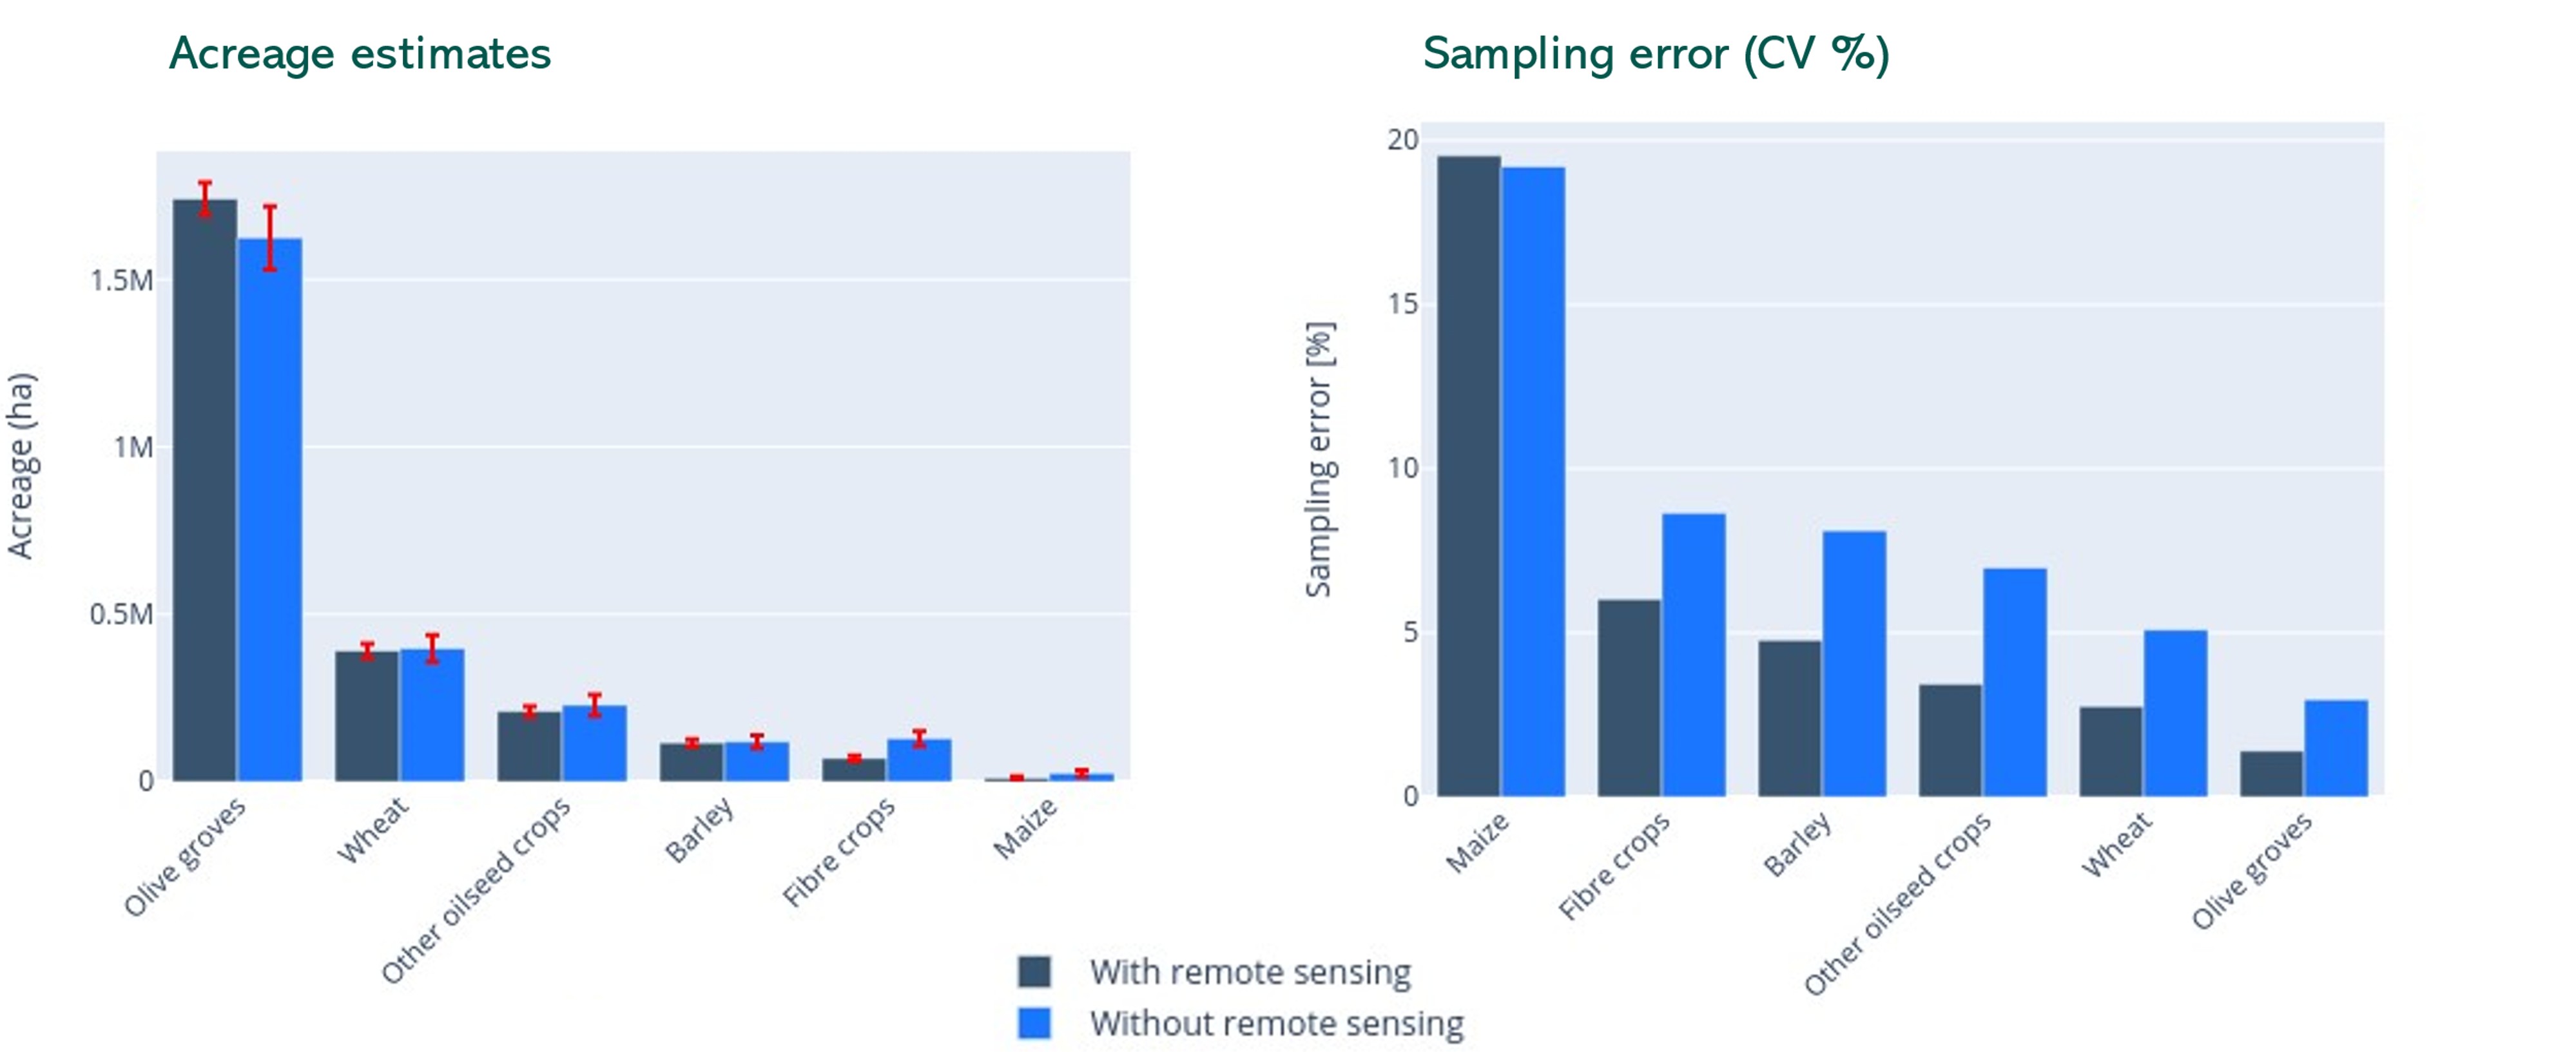
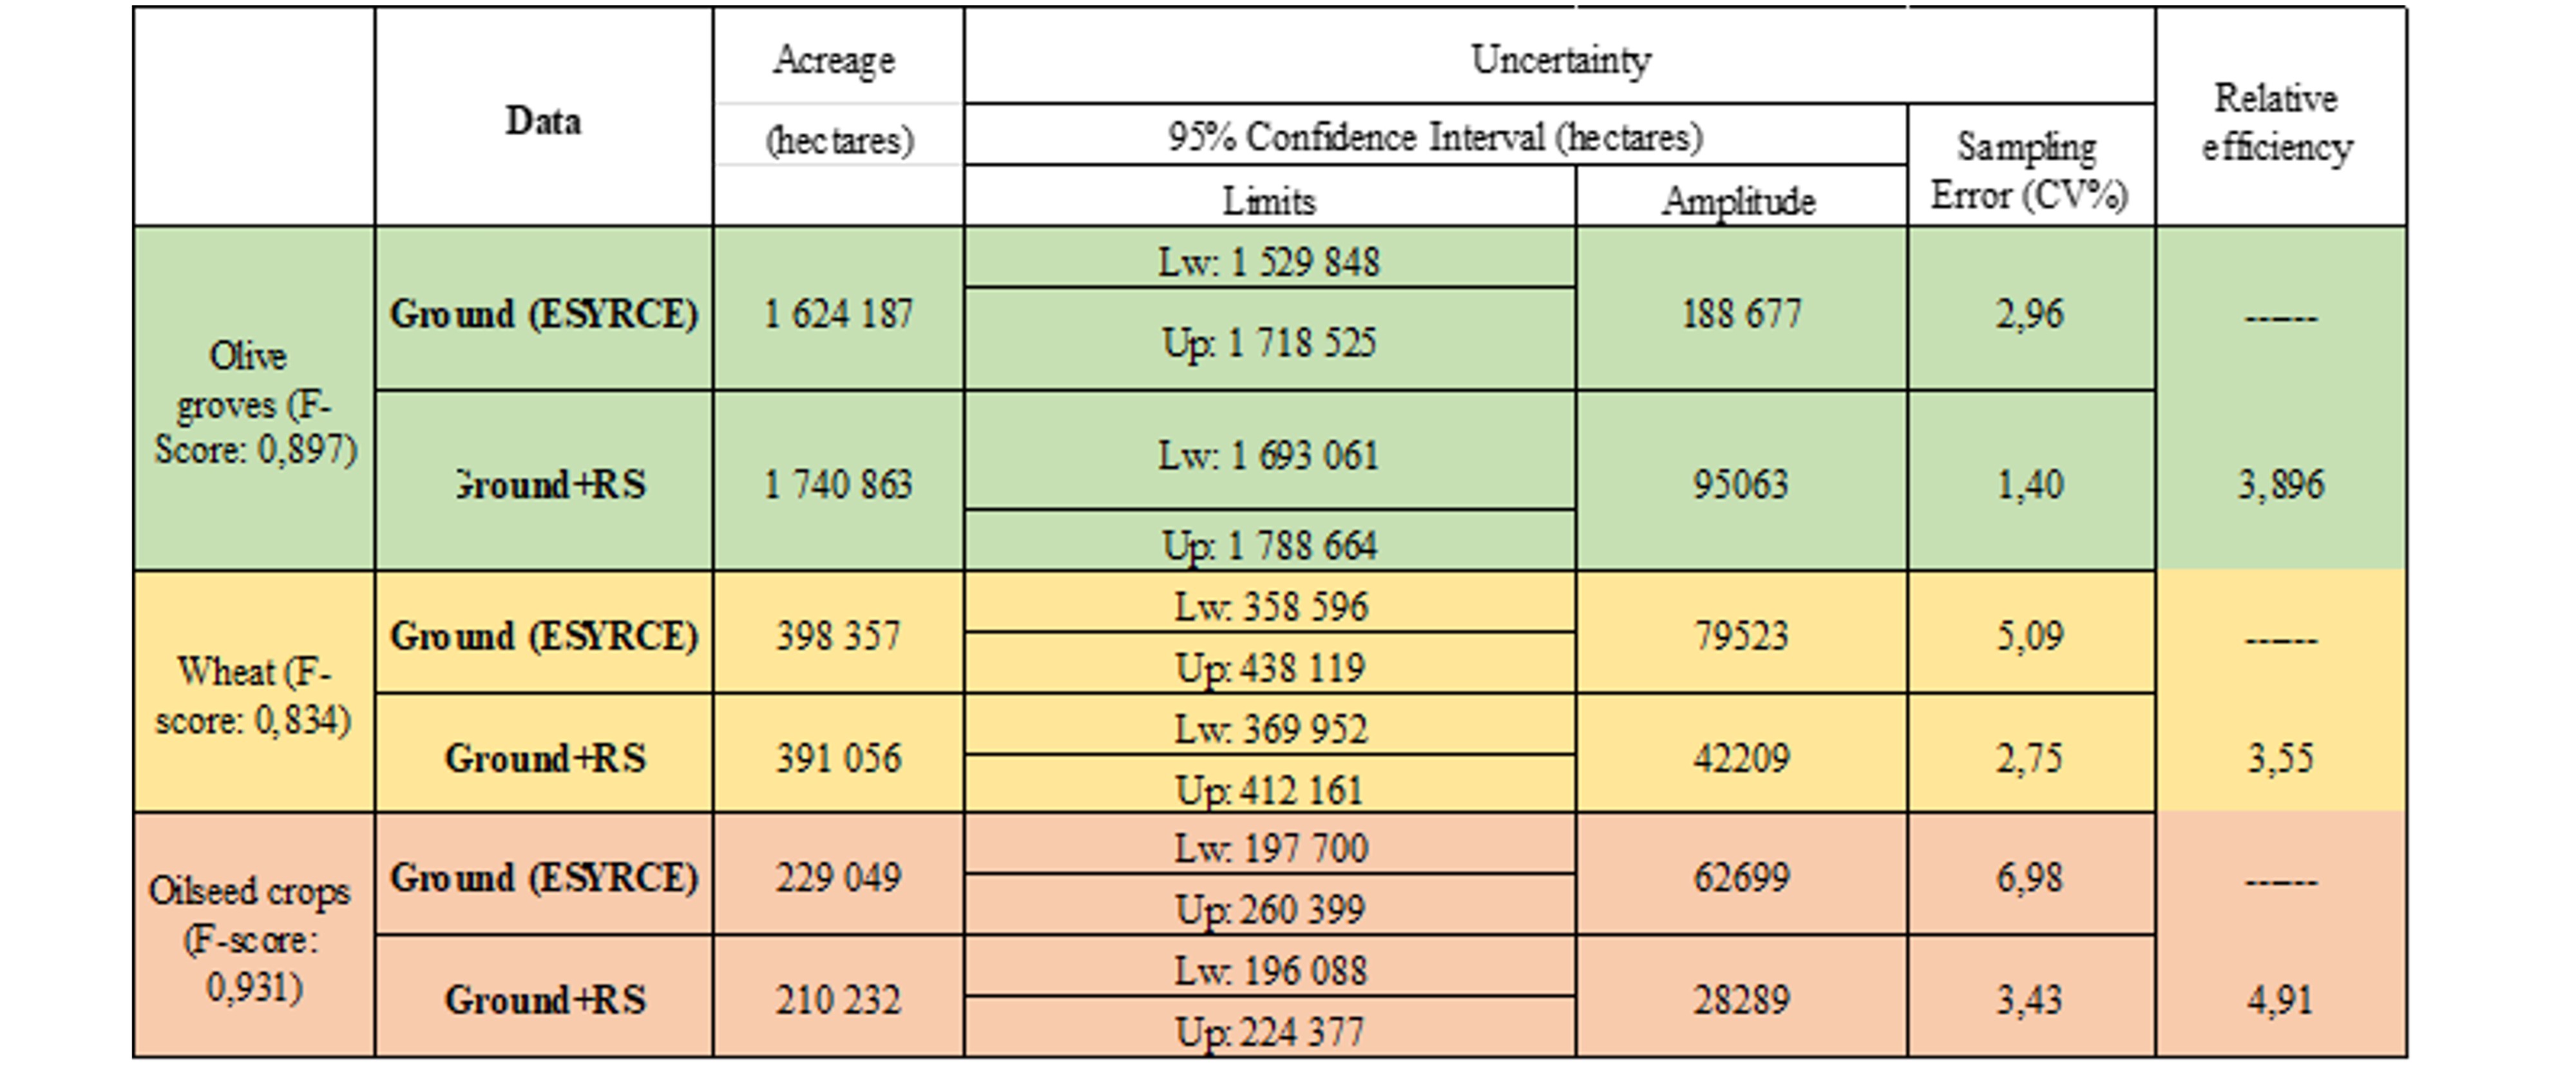
EO data (crop type map) is included in the database provided by NSO and we evaluate the effect on the cost-efficiency of the sampling design currently used. To evaluate this effect, we will compare the cost-efficiency of the current sampling design where only ground data “G” (without EO data) are used, with the cost-efficiency of the current sampling design where both ground data “G” and EO data are used (i.e. G+EO).
Option 2: reducing the survey cost without increasing the estimation error
EO data is used to reduce the survey cost, by supporting the interpretation of segments without going to the field.
Use case 2: EO data to reduce the sampling error – Castilla y Leon
Use case 3: EO data to reduce the sampling error – Andalusia
Crop yield estimation approach
Yield Estimation Approach:
Looking at 2 key criteria: survey cost and accuracy. Cost-efficiency = survey cost multiplied by sampling variance
- Smooth Time Series: This approach involves analyzing the time series data of crop growth. By smoothing out the fluctuations in the data, it becomes easier to identify trends and patterns that are crucial for accurate yield estimation.
- Emergence: This phase focuses on the initial growth stage of crops. Estimating yield at this stage involves examining factors like seed germination rate, early growth vigor, and environmental conditions impacting the early life of the crop.
- Mid-Growth: During mid-growth, the analysis shifts to assessing the development of the crops. This includes measurements of plant height, leaf area index, and other indicators of healthy growth, which are critical for predicting yield outcomes.
- Max Vegetation: At this stage, the crop reaches its peak in terms of vegetation. Monitoring the maximum vegetation gives insights into the potential maximum yield, assuming favorable conditions continue.
- End of Vegetation: This marks the closing phase of the crop's growth cycle. Understanding the decline or cessation of vegetation growth helps in predicting the final yield and timing of harvest.
- Yield Feature Extraction: This process involves extracting key features from the crop data that are most relevant for yield prediction. This includes various biophysical and environmental parameters.
- Vegetation Yield Feature (YF): This feature extraction focuses specifically on vegetation-related factors such as leaf area, chlorophyll content, and overall plant health.
- Weather Yield Feature (YF): Weather YF takes into account climatic conditions like temperature, rainfall, and humidity, which significantly affect crop yield.
- Soil Moisture Yield Feature (YF): This approach examines the moisture levels in the soil, a crucial factor for crop growth and yield, especially in areas prone to drought or excessive rainfall.
- SAFY Yield Feature (for cereal crops): SAFY (Simple Algorithm For Yield estimation) is a specialized yield feature extraction method tailored for cereal crops. It considers specific factors unique to cereals, such as grain filling rate and cereal crop phenology.
Each of these approaches offers unique insights into the yield estimation process, and together, they provide a comprehensive view of the factors influencing crop yield.
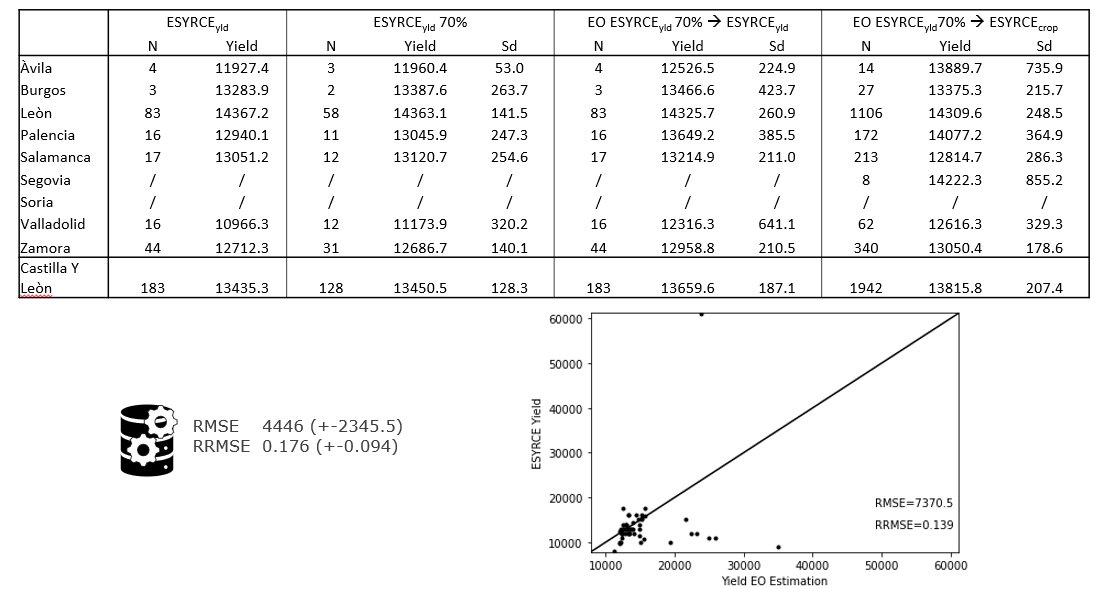
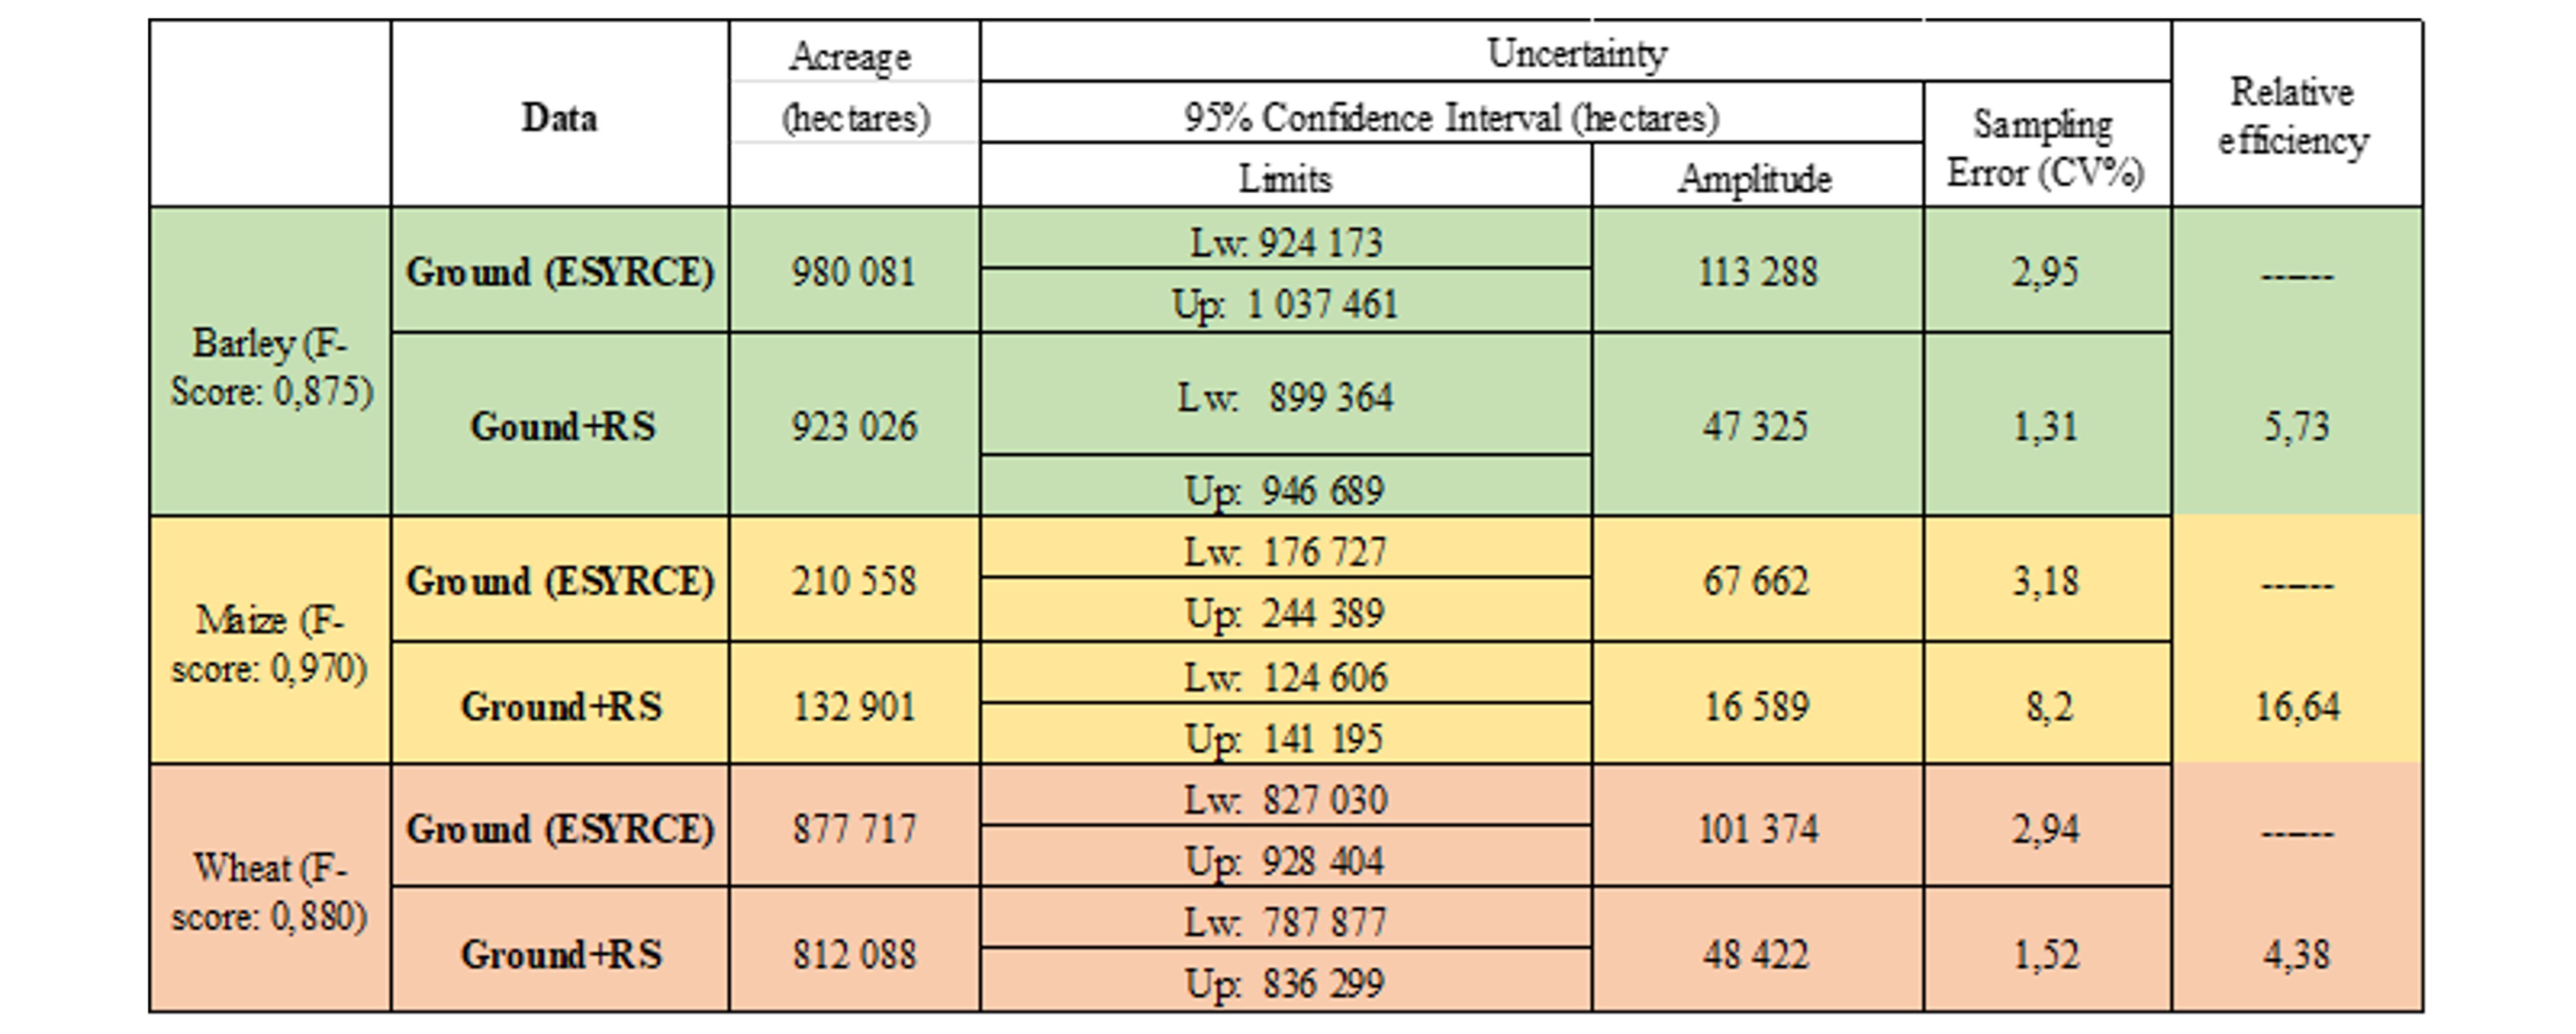
Case study: sub-national estimation process
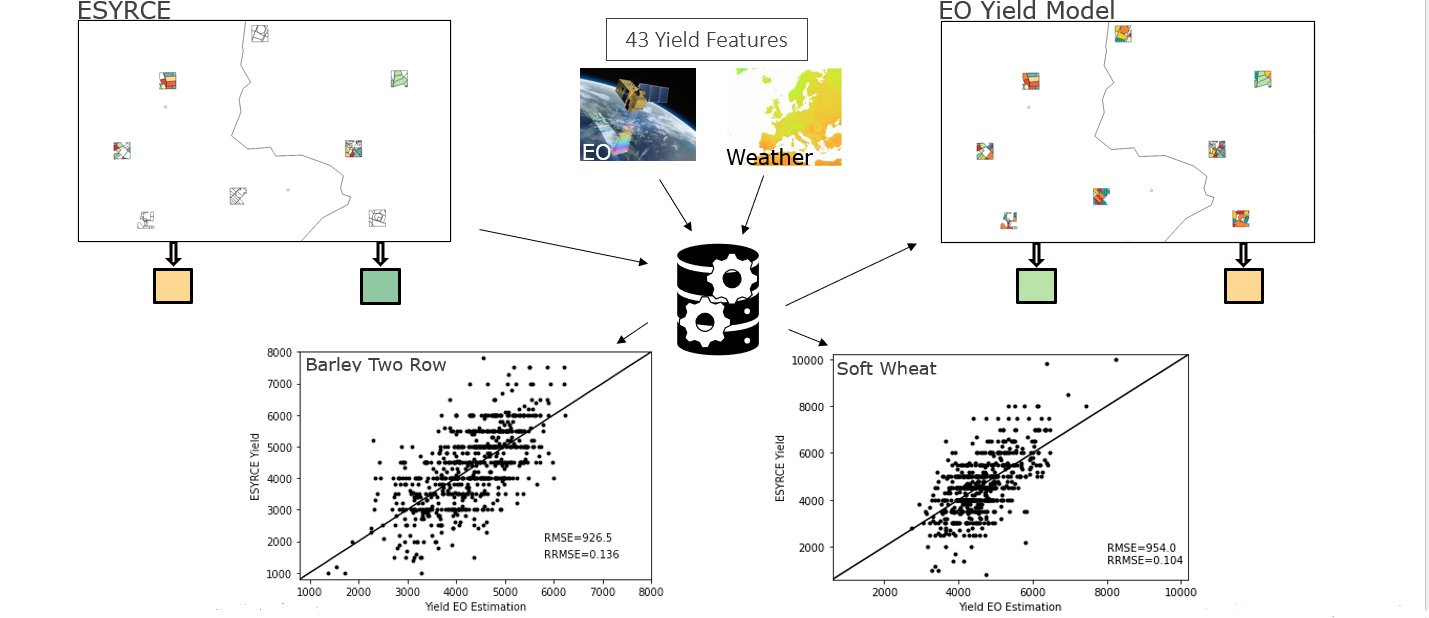
Case study: preliminary results
Barley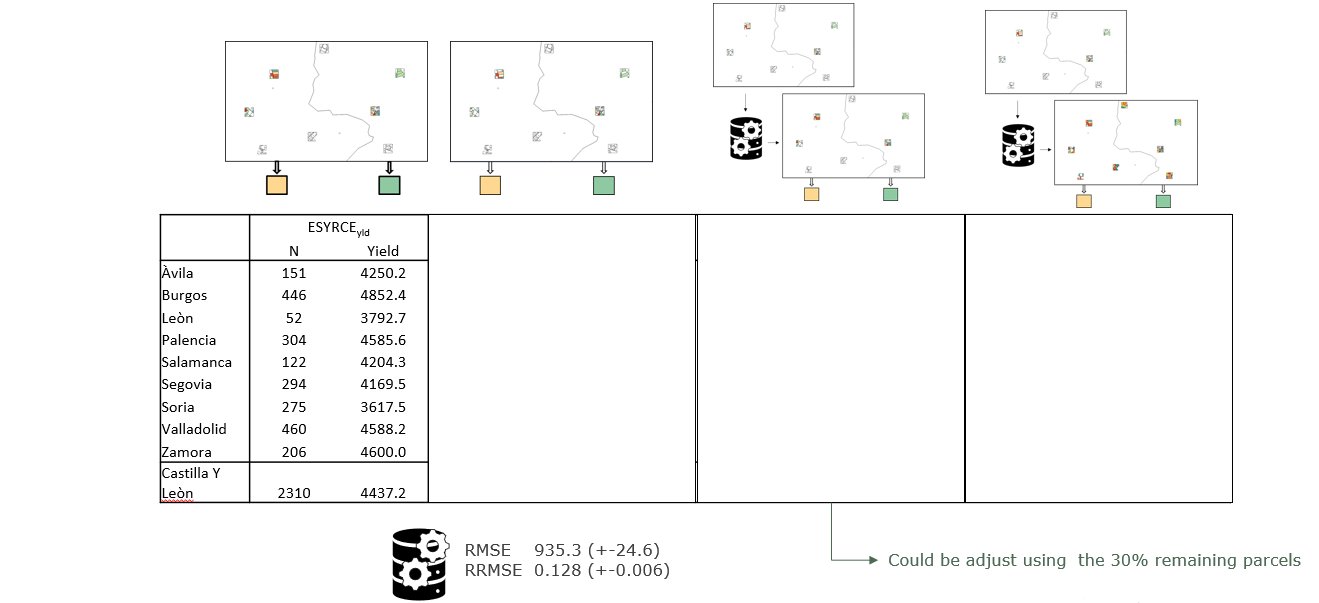 Soft wheat
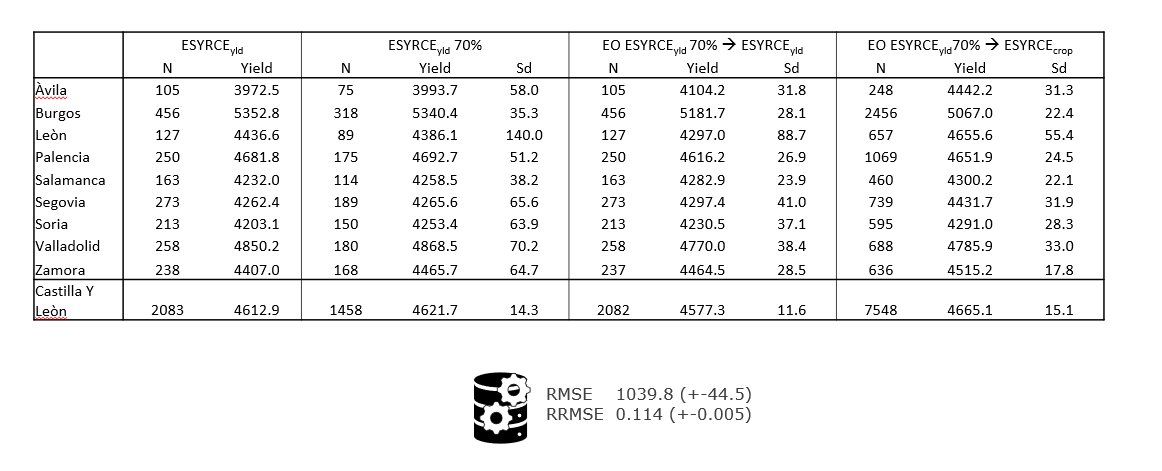 Maize
Maize