The project was marred by a daunting challenge: the reinforcement of the input dataset prior to crop mapping. This step was a make-or-break moment for the project, as the accuracy and completeness of the input data were vital to the success of the mapping.
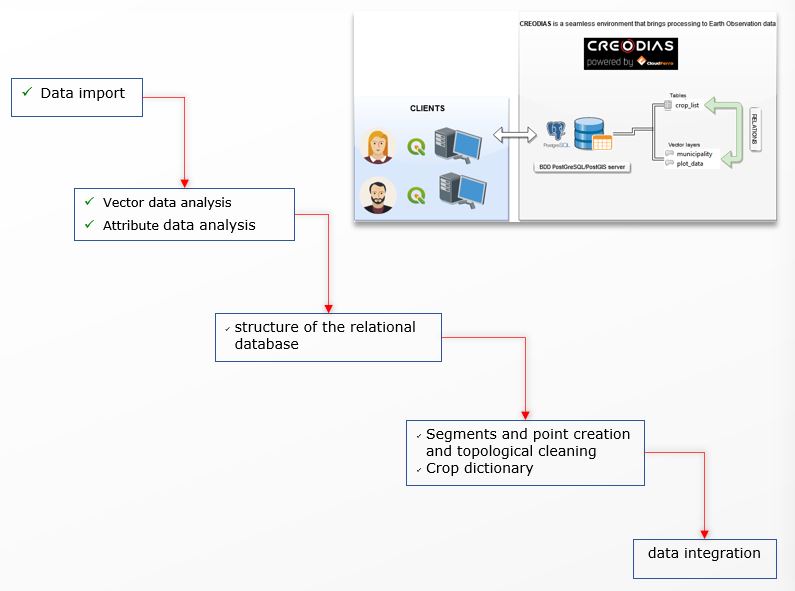
National Statistical Offices (NSOs) at the test sites presented a hodgepodge of data structures, constructed in a variety of ways. Understanding these complex structures and adapting them to the standards of SEN4STAT was a daunting task, particularly in terms of information technology. The databases encountered were a jigsaw puzzle of elements of different shapes, with missing or incomplete pieces, making the task even more challenging.
But the stakes were high. The lack of standardization in the input data from the NSOs could have led to inaccuracies in the crop mapping, with dire consequences for agricultural production and food security. Reinforcing the input dataset was a crucial step in ensuring the accuracy and reliability of the crop mapping.
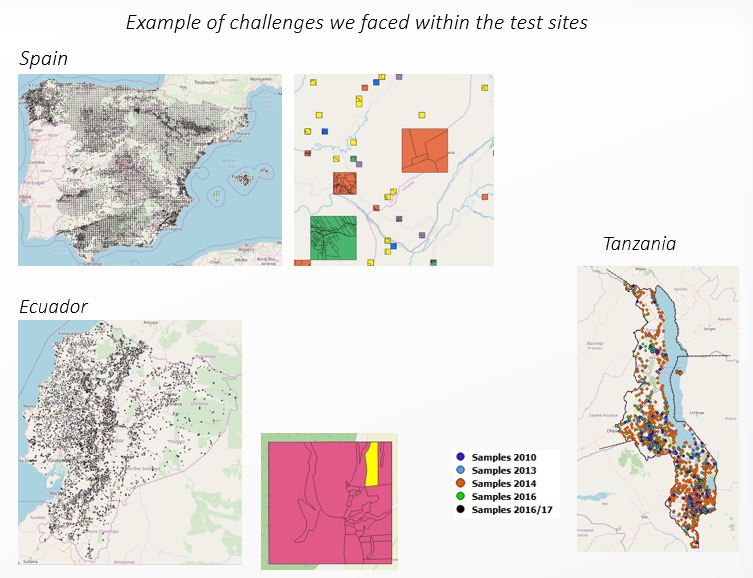
The main challenge were to retrieve existing data from selected countries - Ecuador, Malawi, Senegal, Spain, and Tanzania - and establish a standardized and quality-assured PostGreSQL database to facilitate secure access to each country's dataset for the processing of Earth Observation (EO) data and generate improved estimates. Additionally, the project aimed to develop tools and methods to support field surveys and provide training on how to implement them. The development of the database structure for EO integration involved several tasks such as the need to harmonize data from different sources, establish a common relational database structure, use a harmonized nomenclature, and store the data in a selected C-DIAS cloud infrastructure, all while ensuring compliance with security policies to ensure confidentiality and data integrity. The ultimate goal of these efforts was to facilitate area and yield estimation and integration with EO data. It is important to note that while most of the issues mentioned above are specific to EO integration, they do not prevent the use of the NSO data on its own.
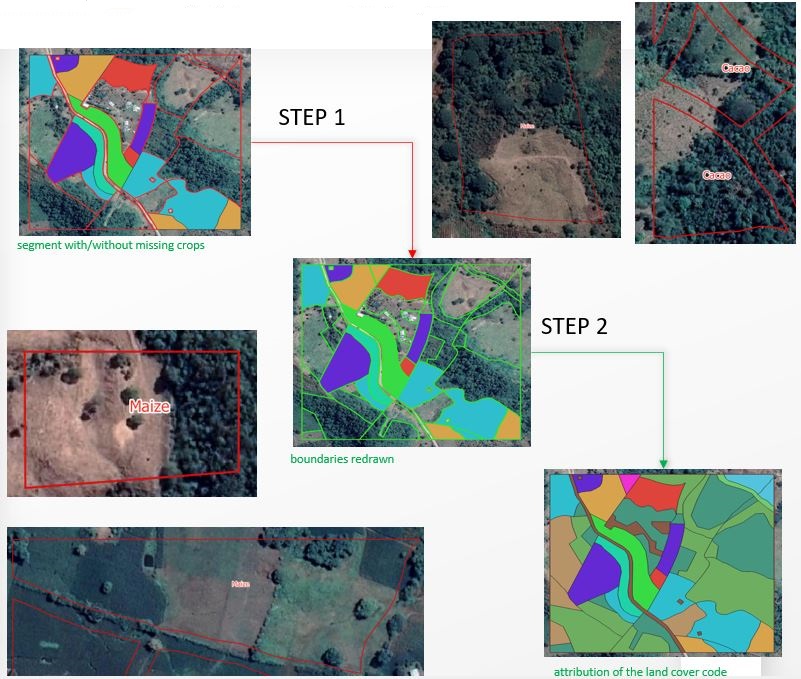
The crop mapping processor, which relied on calculations based on "machine learning," required input data that was as "pure" and "homogeneous" as possible. But as the image on the right shows, polygons from NSO datasets were often misclassified or represented outdated areas, introducing bias and potentially leading to poor results.
The challenge was to perform quality control on the polygons, reshaping or complementing them as necessary to ensure they accurately represented parcels. The task also involved checking the information within the polygons to ensure consistency with observations. And it was crucial to correct any non-agricultural information, particularly classes that could be mistaken for agricultural land cover.
This was a herculean task, but the team rose to the challenge and ultimately succeeded in reinforcing the input dataset, laying the foundation for accurate and reliable crop mapping.
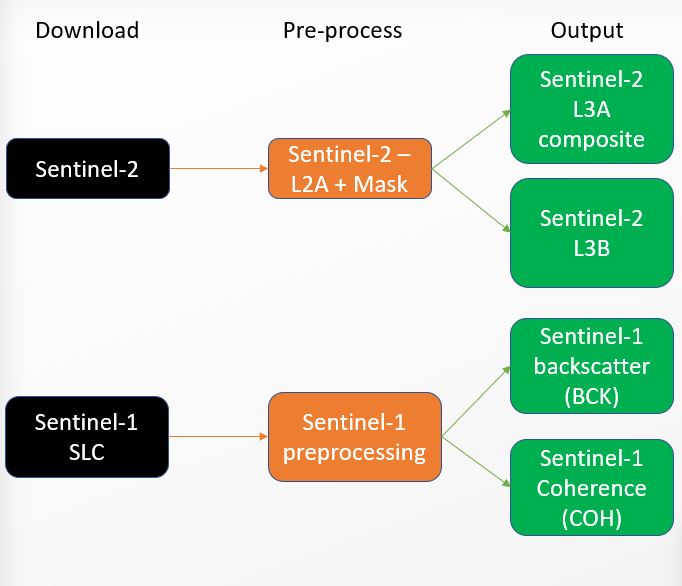
The Sentinel-1 SLC products are transformed into GeoTIFF format with either float32 or uint16 pixel type, compressed and gridded to the S2 grid. The products are grouped into folders by SLC scene, by polarization and then by type, including backscatter or coherence. Each S1 L2 folder contains multiple products, including BCK and COHE products with corresponding quicklooks and metadata files. The system also generates 2NS2 backscatter and 2Ni*NS2 coherence products gridded onto the S2 grid. The Sentinel-2 and Landsat 8 L1C/L1T products or existing Sentinel-2 L2A products, along with the DEM, are processed to create atmospherically corrected L2A products and validity masks for clouds, water, snow and saturation. The Sentinel and Landsat 8 L2A with Validity Flags products, combined with the model, generate NDVI, NDWI, brightness, LAI, fAPAR and fCOVER, along with quality flags. The system also produces cloud-free composite bands for each input product band, with quality flags indicating the number of valid observations, status of the pixel, and the weighted average of dates used in the synthesis.
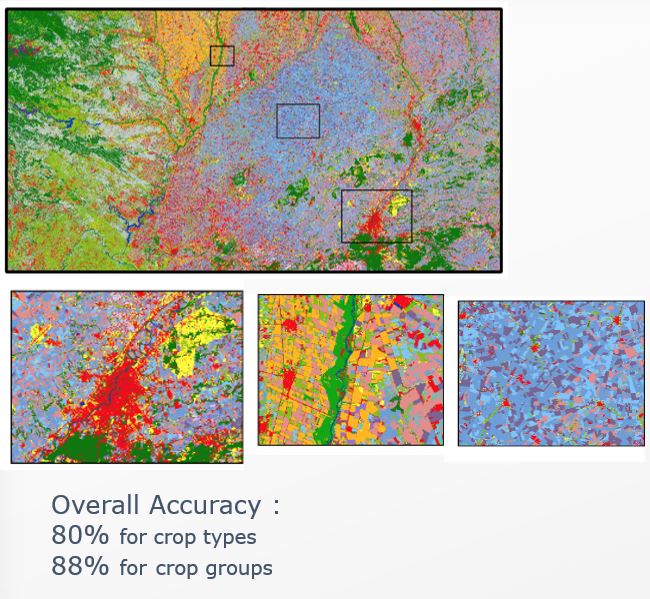
The purpose of the system is to produce various pixel-based maps with a high degree of accuracy and precision. Utilizing NSO imported in situ parcel datasets and crop dictionaries, along with satellite data from Sentinel-2 and Sentinel-1, the system produces cropland and non-cropland maps, crop type maps, and a range of other maps. These maps are generated with a focus on providing a clear picture of the landscape and are accompanied by classification confidence maps that provide a level of detail and accuracy that is essential for informed decision making. Whether you're a seasoned expert or just starting out, this system is designed to make the process of producing high-quality maps fast, efficient and accessible.
The crop type map is produced through a process of supervised classification. This process involves selecting in-situ data, computing features, sampling, training, classification and validation. The features used in the classification process include both optical features such as reflectances, spectral indices, biophysical indices, temporal statistics and others, as well as SAR features such as backscatter, coherence, and temporal statistics. The classification is performed using the Random Forest (RF) algorithm, currently implemented through OpenCV, and the code is largely written in native code and executed using the Orfeo ToolBox (OTB) and Python. The system also utilizes grouping dictionaries to provide a high degree of accuracy and precision in the resulting crop type map.
The system continues to evolve and improve, with the goal of producing even more comprehensive and accurate maps. This is achieved through the addition of more indices and features, as well as fine-tuning of parameters. The system's flexibility has also been increased through options for feature selection and the ability to work with multiple strata. The optimization of the system's layout, encoding, and compression/COG has helped to streamline the processing and ensure fast and efficient performance. Additionally, the system is fully integrated with the Broceliande platform, allowing for the production of annual and permanent crop maps that are both comprehensive and up-to-date. These efforts combine to create a powerful tool for producing high-quality maps and making informed decisions about land use and management.
The SEN4STAT team produced results over the test sites picked for the project. The main expectations from the Earth Observation (EO) data were cost-efficiency, improved accuracy and timeliness of crop acreage and production estimates, and a better understanding of country heterogeneity. The team aimed to integrate EO and ground data in the calculation of crop acreage and production statistics to reduce survey costs without increasing the standard error. Additionally, further reductions in survey costs were expected by replacing survey data with EO data on specific crops. The team also aimed to isolate crops for which the EO cost-efficiency is very high in a specific stratum, in such a way that the size of the survey sample could be greatly reduced in those specific strata (sampling design). The team also aimed to disaggregate the estimates obtained at the national level at the level of minor administrative units (more than NUTS-3) and improve the timeliness of their crop acreage and production estimates. The team also aimed to use EO data to reduce uncertainty in collected ground data (not a strict statistical use case).
Reinforcement of datasets – A challenge