survey conducted by
Ministry of Agriculture, Fisheries and Food;
Department of Analysis and Agricultural StatisticsEarth Observation Data
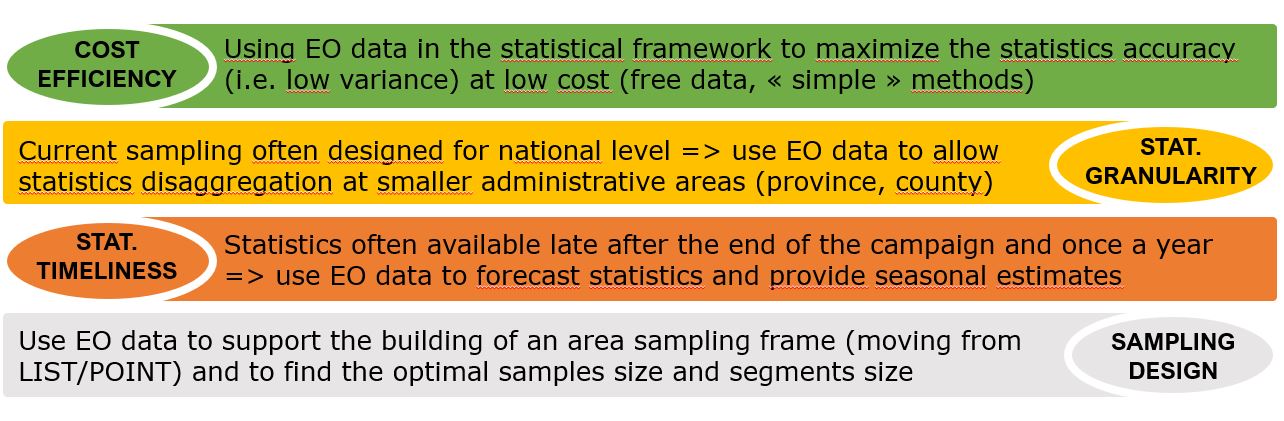
Main expectations from EO data
This approach is being implemented in the Spain prototype of the Sen4Stat project. By integrating EO and ground data, the Spain prototype aims to reduce survey costs while maintaining accuracy and improving the timeliness of crop acreage and production estimates. The prototype also seeks to better cover the heterogeneity of the country by disaggregating national estimates at the level of minor administrative units. In doing so, the prototype will utilize EO data to reduce uncertainty in collected ground data. By combining these approaches, the Spain prototype of the Sen4Stat project aims to enhance agricultural statistics and provide cost-effective and timely data to decision-makers.
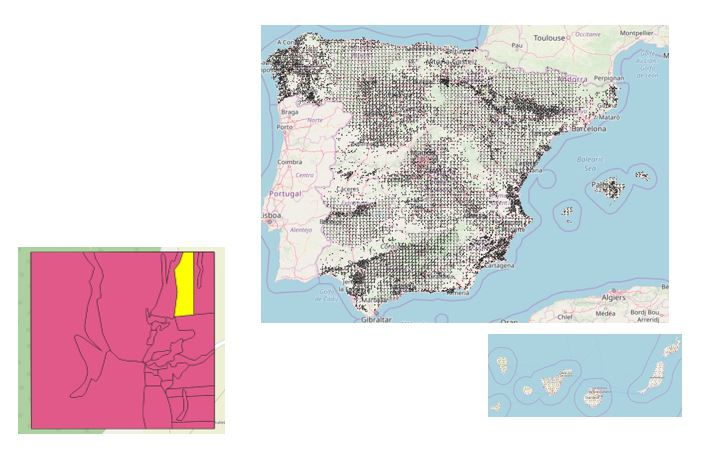
ESYRCE Survey Database
ESYRCE survey database is an integrated list and area frame survey that offers comprehensive agricultural data in Spain. The database is structured around square segments of varying sizes, ranging from 700m to 250m, which are further divided into agricultural plots. This design allows for detailed information to be collected on a wide range of crops across the country. The database covers three distinct periods: 2001-2015, 2016-2018, and 2019. It provides yield information through two approaches: crop cutting and farmers' estimates. These yield estimates are based on comprehensive data collection and rigorous quality control processes, ensuring that the data is reliable and useful for various purposes, including agricultural research and policymaking.
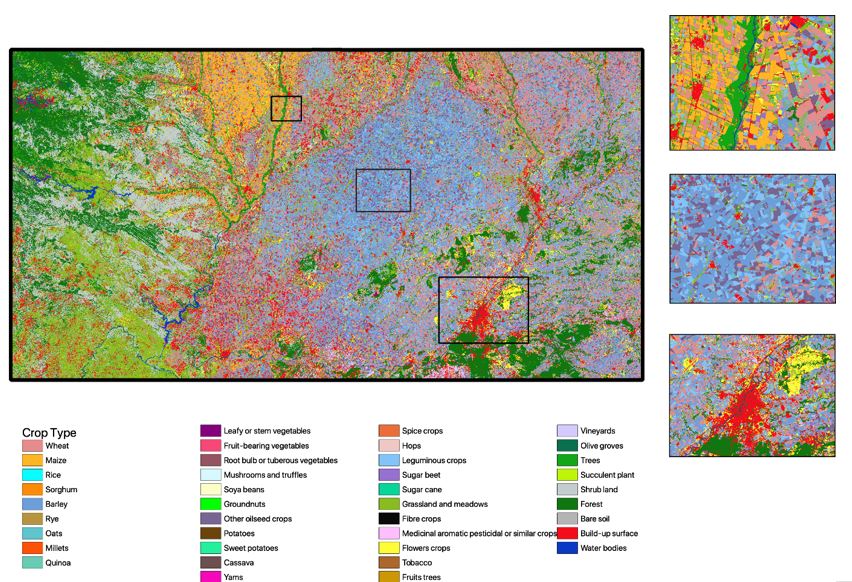
Crop mapping
Wall-to-wall 10m crop type map including annual and permanent crops (35 crop classes)
A highly accurate crop type map is a crucial tool for researchers and policymakers alike. To achieve this, a classification workflow was implemented to generate a wall-to-wall 10m crop type map, which includes both annual and permanent crops. The classification was conducted using the Random Forest and Neural Network (Transformer) algorithms, which were trained on features including S-2 bands: B03-04-05-06-07-08-11-12, NDVI NDWI, and BRIGHT timeseries. The SMOTE algorithm was also applied to ensure that minor crops were accurately represented in the map. The resulting crop type map has an overall accuracy of 77% and covers the period of January 2018 to December 2018. With 35 crop classes represented in the map, this highly accurate and detailed tool provides valuable insights into Spain's agricultural sector and can inform a range of decisions in the field.
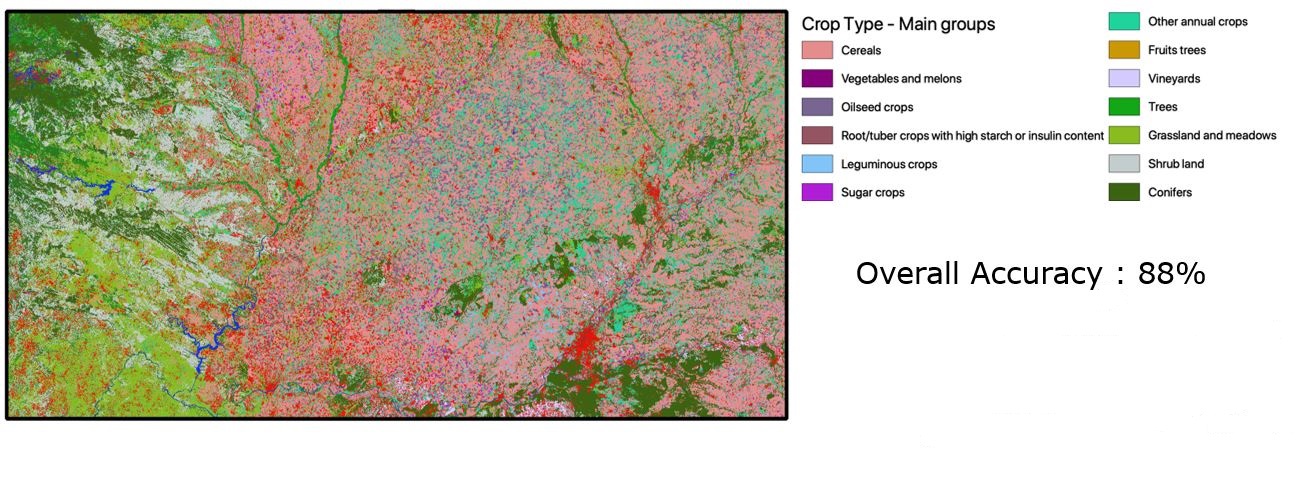
Moving to main crop groups
Grouping individual crop types into main crop groups is a crucial step in simplifying agricultural data, making it more accessible, and facilitating decision-making. The accuracy of this process is paramount, and the resulting data should be reliable and informative. The grouping of crop types in main crop groups has resulted in a highly accurate dataset, with an overall accuracy of 88%. By simplifying the data in this way, it becomes easier to identify trends and patterns that might be difficult to discern otherwise, providing valuable insights into the agricultural sector. The resulting data can also be compared across different regions or countries, making it a useful tool for policymakers seeking to make informed decisions. Overall, moving to main crop groups is an effective way to analyze agricultural data and can support evidence-based policymaking.
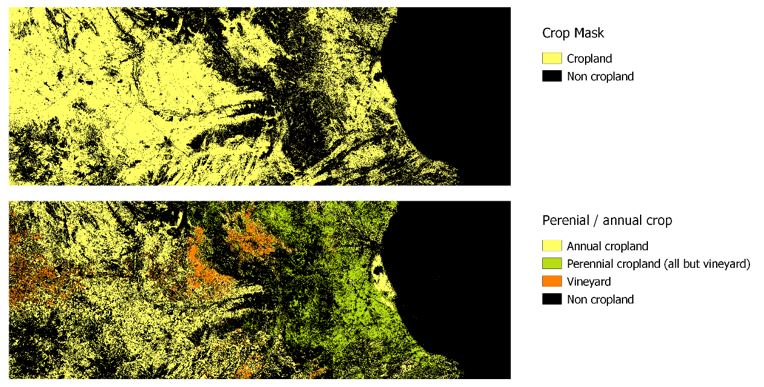
Hierarchical classification between annual and permanent crops
Hierarchical classification between annual and permanent crops is a crucial step in generating accurate crop maps. This process involves using a specific model to differentiate between the two types of crops, ensuring that the resulting map is reliable and informative. By discriminating between annual and permanent crops, a permanent/annual crop map can be generated, which can be used to improve the overall accuracy of the crop type map. The use of this map ensures that permanent crops, which are often harder to identify, are accurately represented in the data. The resulting data can then be used to analyze and interpret agricultural patterns and inform decision-making. The hierarchical classification between annual and permanent crops, and the generation of a permanent/annual crop map, are essential steps in improving the accuracy of crop maps and generating reliable agricultural data.
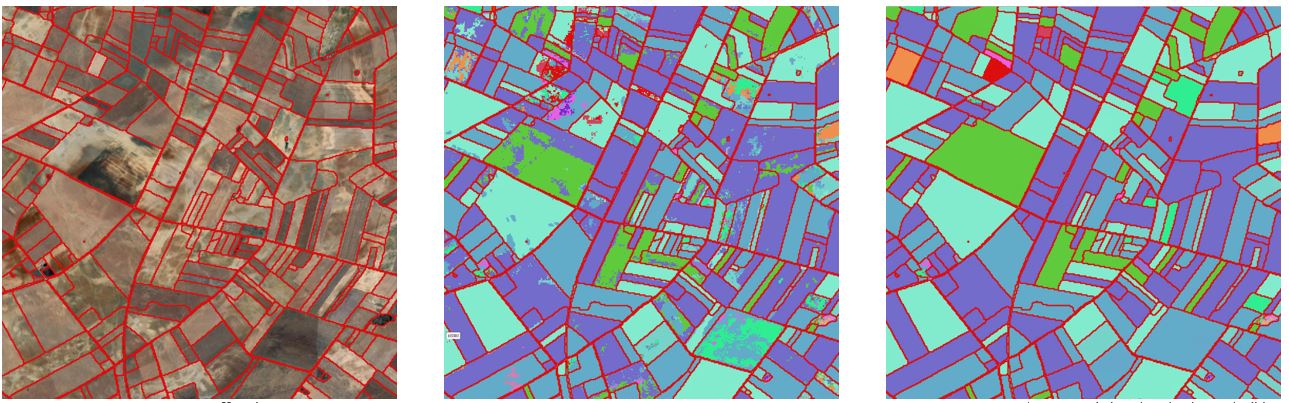
Further ways of improvement
To generate more accurate and reliable crop maps, there are several further ways of improvement that can be considered. One approach is to include SAR Sentinel-1 time series data, which can provide additional information on crop characteristics such as moisture content and vegetation density. This data can be used to enhance the accuracy of existing crop maps and identify patterns and trends that may be difficult to detect otherwise. Another approach is to obtain field boundaries by segmentation and filtering the classification using AI deep learning segmentation based on LPIS data. This method involves segmenting satellite images into smaller, individual field boundaries using machine learning algorithms, which can then be filtered and verified against LPIS data. The resulting data can be used to generate more accurate and detailed crop maps, enabling better insights into the agricultural sector and supporting evidence-based decision-making.
Crop yield estimate
First results
Use cases
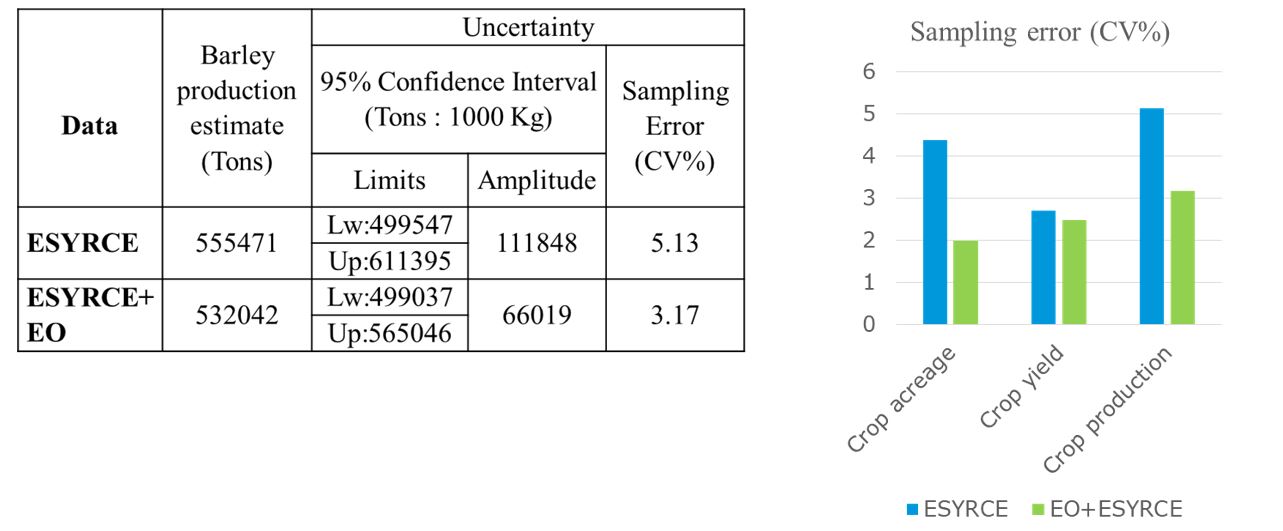
One of the key use cases for agricultural data is improving cost-efficiency while maintaining accuracy in estimating crop acreage and yield. This approach involves utilizing advanced technologies to reduce survey costs and increase efficiency while ensuring that the resulting data is reliable and informative. By integrating EO and ground data in the calculation of crop acreage and yield statistics, costs can be reduced without increasing the standard error. This can be further achieved by replacing survey data with EO data for specific crops, especially minor crops, in such a way that the size of the survey sample can be reduced in those specific areas. These approaches can also improve the timeliness of crop acreage and yield estimates, allowing for early forecasts before the end of the season or just after. Overall, this use case provides valuable insights into the agricultural sector, supports evidence-based policymaking, and enables better decision-making regarding crop acreage and yield estimates.
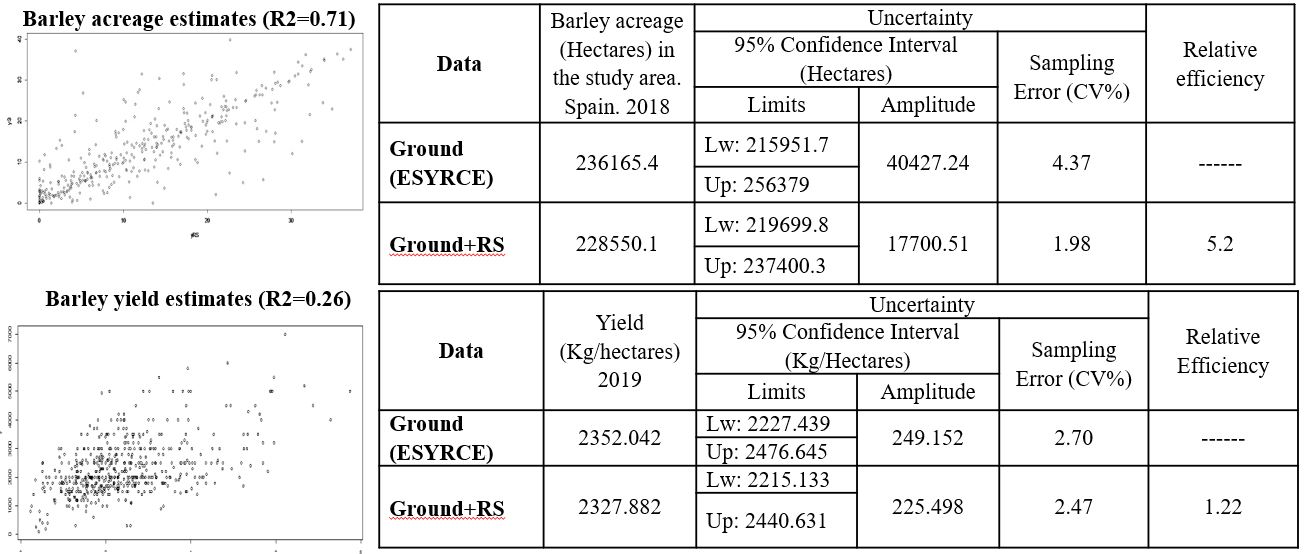
Use case 1: Cost-efficiency / Crop production
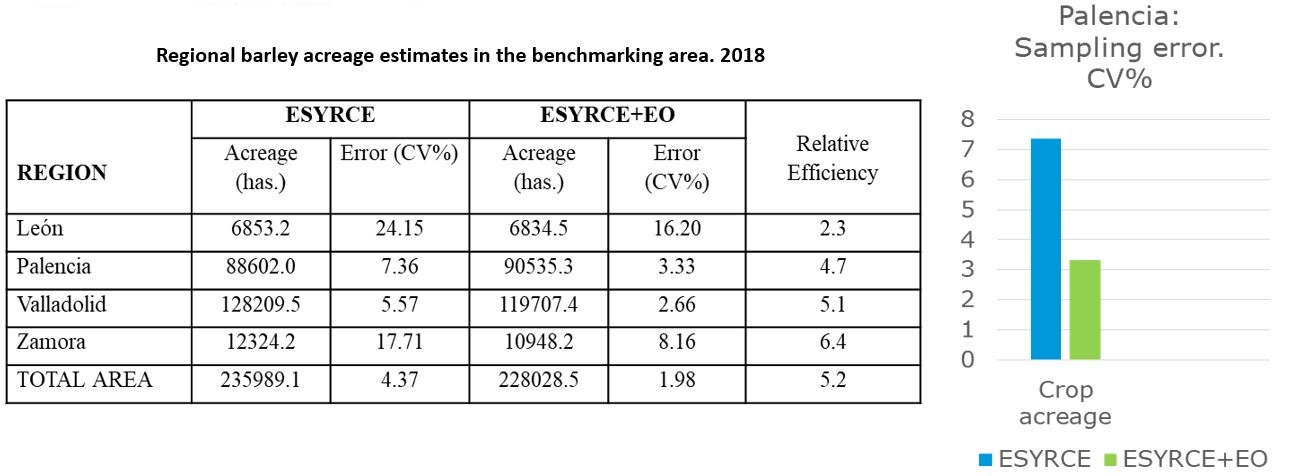
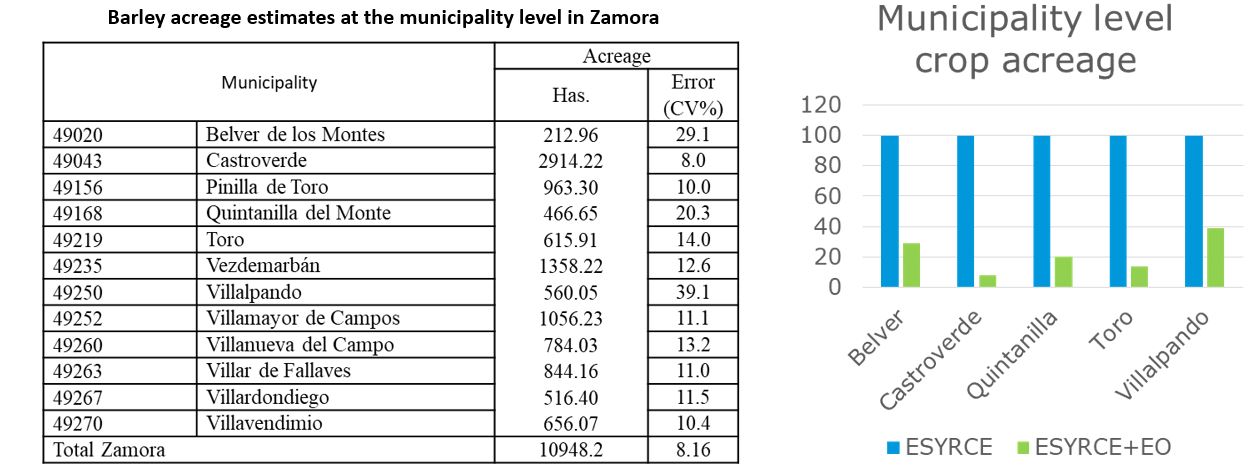
Use case 2: for agricultural data is improving the granularity of regional level crop acreage estimation using high-efficiency EO data
This approach can significantly reduce estimation errors, making them acceptable at the regional level.
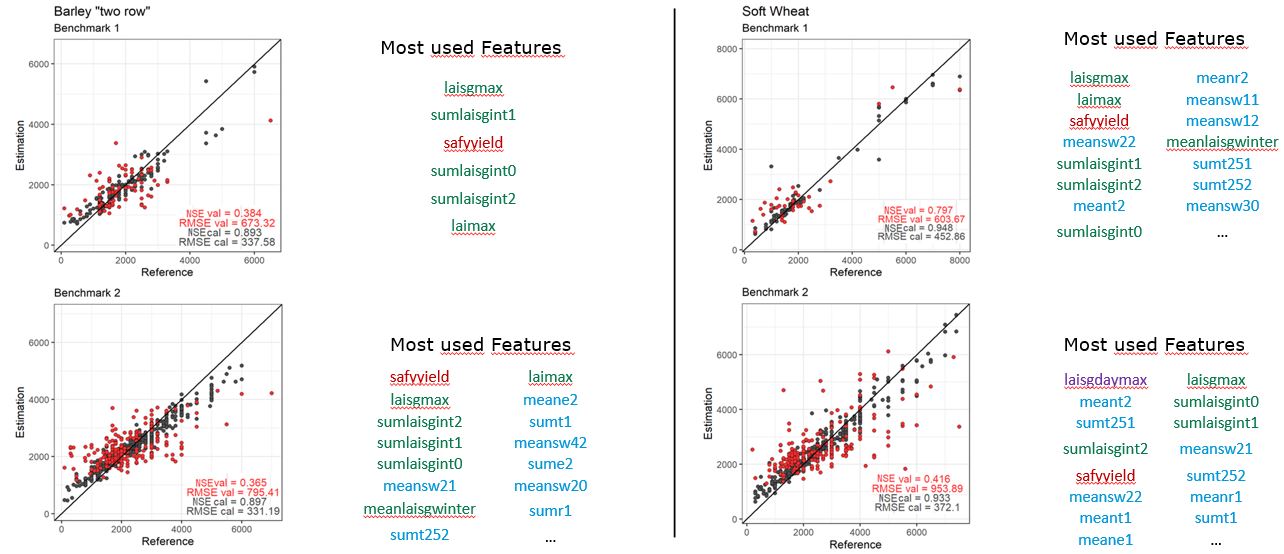
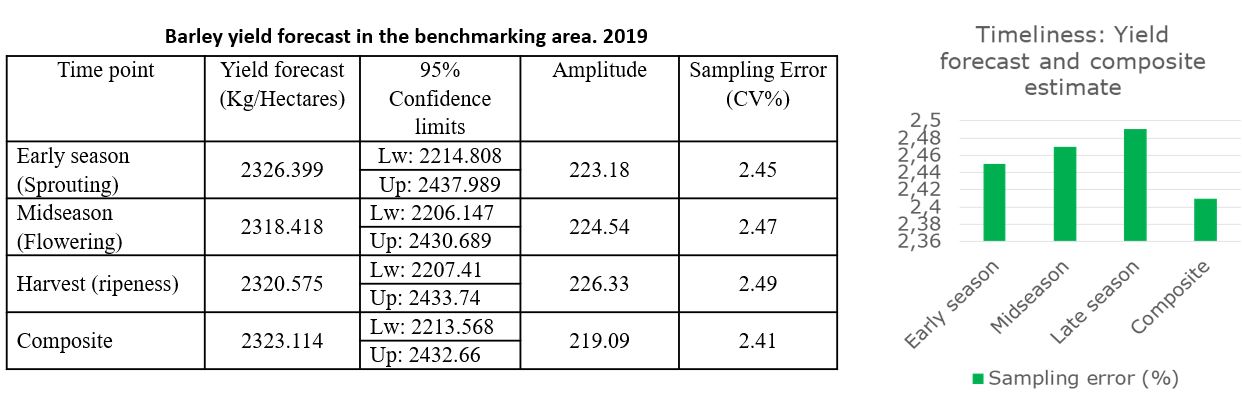
Use case 3: Timeliness - Yield forecasting using ESYRCE data and LAI temporal series
In this use case for agricultural data, we utilize ESYRCE data and the temporal series of leaf area index (LAI) to develop a yield forecasting model at several time points throughout the year. This approach enables us to generate improved composite estimates at harvest time, providing valuable insights into crop production and yield at different stages of the growing season.
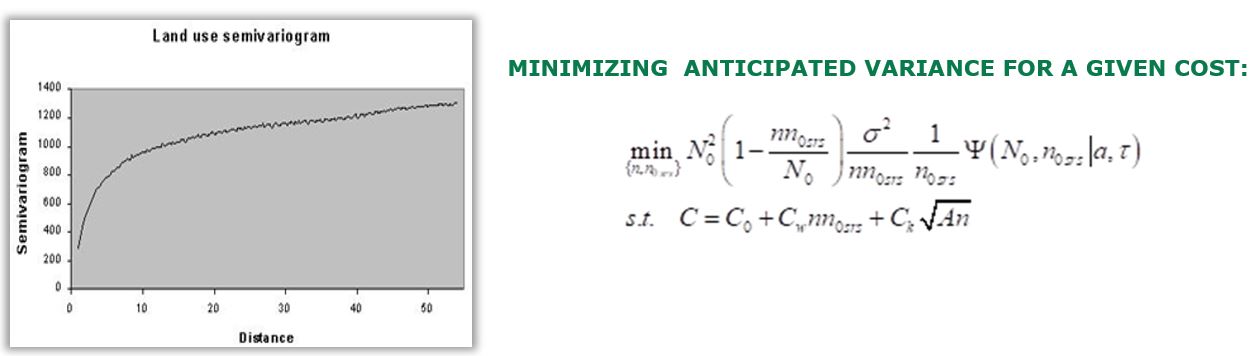
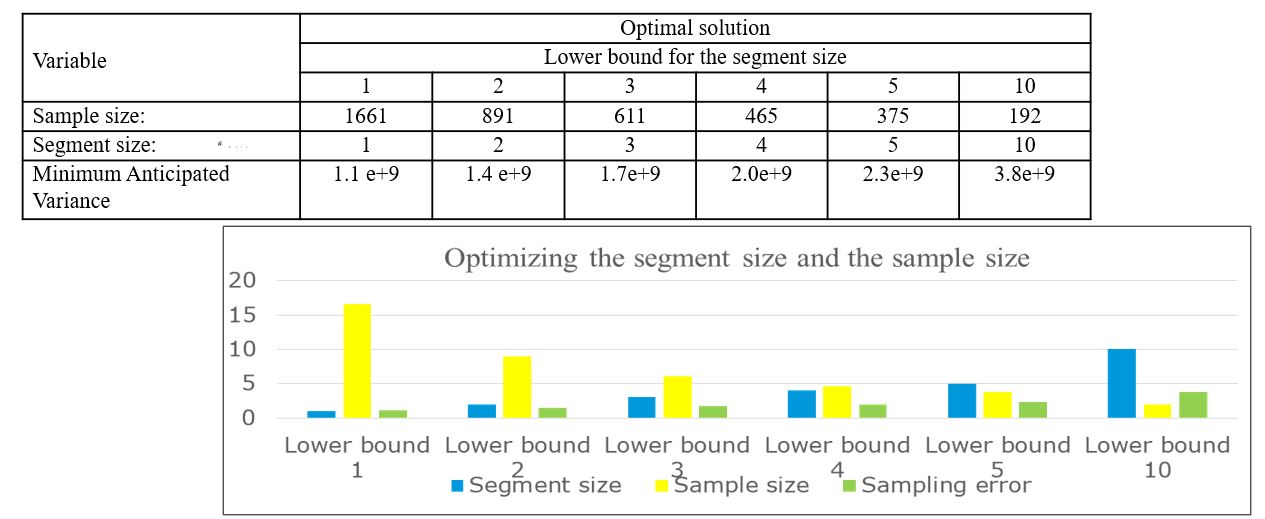
Use case 4: Optimizing sample design
Utilizing EO data for spatial correlation analysis. In this use case for agricultural data, we focus on optimizing the sample design for improved accuracy and efficiency. The segment size and sample size are two main aspects of the sample design that can be optimized, and EO data can play a key role in this process. By utilizing EO data, we can identify the spatial correlation structure of specific crops, allowing for more effective segmentation and sample size optimization. The resulting data can provide valuable insights into crop patterns and support evidence-based decision-making regarding agricultural policies. This use case demonstrates the unique contribution of EO data to optimizing the sample design, enabling better accuracy and efficiency in crop acreage and yield estimation.